
Traditionally ntop has focused on passive traffic analysis. However we have realized that the traffic monitoring world has changed and looking at network flows is no longer enough:
- People want to enforce policies: if the network is hit by a security threat you need to stop it, without having to tweak with router ACLs or deploying yet another box to carry on this task.
- Combine visibility with security: flow-based analysis has to be combined with traffic introspection, activities that tools like Bro, Suricata and Snort do. Unfortunately these applications are CPU-bound so, in order to boost their performance, there are two viable ways: reduce the packet-processing cost (this has already been done years ago); or reduce the ingress by not forwarding to these applications the traffic that it does not make sense to process (e.g. YouTube packets or the payload of encrypted SSL packets).
- 40 Gbit networks (or multi-10Gbit links) are common, if not mainstream, and 100 Gbit is becoming commodity, therefore we need to be able to accurately (i.e., no sampling) monitor traffic at these rates.
- Effectively utilize all the CPU cores as multi-processor and multi-core architectures are becoming cheaper every day (today you can buy a 22 physical cores CPU or a 10 physical core CPU for less that 1000$).
- Deep packet inspection is now pervasive and thus there is the need to augment the old “host 192.168.2.222 and port 80″ BPF syntax with Layer-7 Applications: “host 192.168.2.222 and l7proto HTTP”. In essence, if packets matter to you, application protocol is yet another dimension you want to explore.
- Integrate packet capture, traffic aggregation, flow processing, and packet analysis into a single physical box, because rack space matters and because now we have the technology and experience to achieve this.
Seen all these challenges above, and considering that we have the hardware and the technology (PF_RING ZC) to face such challenges, we have decided to rethink traffic monitoring and to design nProbe cento (cento in Italian means 100). Cento is not yet another flow-based probe. Cento is a compact application designed to a limited number of tasks very very fast, up to 100 Gbit. This because we want to compute flows out of the totality of ingress traffic.
So, yes, cento can operate at 100 Gbit unsampled and, optionally, do packet-to-disk recording with on-the-fly indexing that includes Layer-7 applications.
In addition, Cento supports packet shunting to:
- Save precious disk space when doing packet-to-disk recording.
- Significantly alleviate the load on IDS/IPS.
If you are wondering what we mean for packet shunting, imagine this. For protocols or flows you do not care much (e.g. a Netflix video or SSL), you may want to save the first packets of the flow (in SSL they contain the certificate exchange, in HTTP you can see the URL and the response) to preserve flow visibility but, at the same time, you would also like to avoid processing all the remaining flow packets. Why you would want to to fill up your disks with encrypted traffic? Why you would want to forward a Netflix video to your IDS/IPS?
Some Use Cases
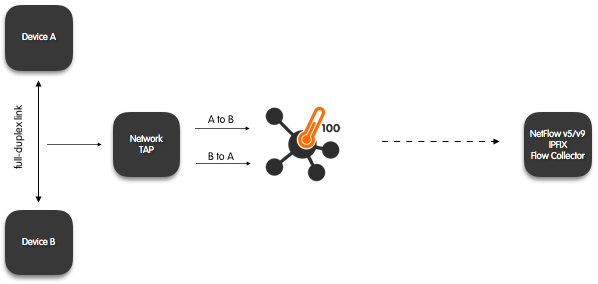
Passive Flow Probe (Packets to Flows) with (optional) Traffic Aggregation
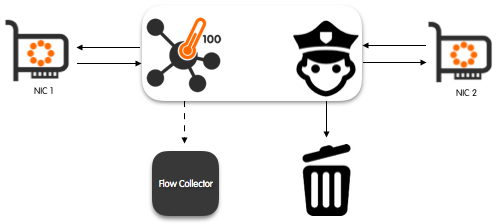
Inline Flow Probe With Traffic Enforcement Capabilities

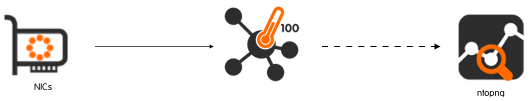
Passive Flow Probe with Zero Copy Packet-to-Disk with Shunting and on-the-fly Indexing up to the Layer-7
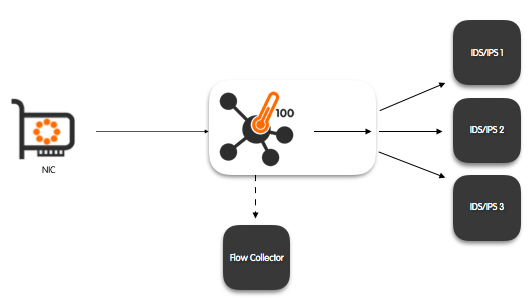 Passive Flow Probe With Zero Copy Balancing to IDS/IPS, including Shunting and Layer-7-based Filtering
Performance Evaluation
In order to evaluate the performance we present some results we obtained on a low-end Intel E3 server priced (server and network adapters) in the sub-1000$ range. In all the tests we have used Intel 10 Gbit NICs and the kernel bypass technology PF_RING ZC.
Flow Generation, Layer-7 Traffic Filtering and HTTP(S) Traffic Filtering
# ./cento-bridge -i zc:enp6s0f0,zc:enp6s0f1 -b doc/bridge.example -B doc/banned.example -v 4 -D 1

[bridge] default = forward
[bridge] banned-hosts = discard
[bridge] Skype = discard
[banned-hosts] 'facebook.com'
[banned-hosts] 'live.com'

Input: 128 IPs
20/Jun/2016 12:49:18 [NetworkInterface.cpp:969] [zc:enp6s0f0,zc:enp6s0f1] [14'340'967 pps/9.64 Gbps][128/128/0 act/exp/drop flows][33'648'924/1'895 RX/TX pkt drops][14'340'966 TX pps]
20/Jun/2016 12:49:18 [cento.cpp:1363] Actual stats: 14'340'967 pps/540'125 drops

Input: 8K IPs
20/Jun/2016 12:47:06 [NetworkInterface.cpp:969] [zc:enp6s0f0,zc:enp6s0f1] [14'178'764 pps/9.53 Gbps][8'192/8'192/0 act/exp/drop flows][37'367'255/0 RX/TX pkt drops][14'178'754 TX pps]
20/Jun/2016 12:47:06 [cento.cpp:1363] Actual stats: 14'178'764 pps/687'835 drops

Input: 500K IPs
20/Jun/2016 12:48:09 [NetworkInterface.cpp:969] [zc:enp6s0f0,zc:enp6s0f1] [10'091'554 pps/6.78 Gbps][500'000/4'288/0 act/exp/drop flows][58'217'698/0 RX/TX pkt drops][10'090'447 TX pps]
20/Jun/2016 12:48:09 [cento.cpp:1363] Actual stats: 10'091'554 pps/4'756'488 drops
Flow generation, on-the-fly Layer-7 Traffic Indexing and Packet-to-Disk Recording
# cento-ids -i eno1 --aggregated-egress-queue --egress-conf doc/egress.example --dpi-level 2 -v 4

# n2disk -i zc:10@0 -o /storage --index --timeline-dir /storage --index-version 2
As the traffic is indexed with both flow index and DPI, you can extract traffic based on DPI as shown below.
# npcapprintindex -i /storage/1.pcap.idx
10 flows found
0) vlan: 0, vlan_qinq: 0, ipv4, proto: 6, 192.168.2.143:49276 -> 192.168.2.222:22, l7proto: SSH/SSH
1) vlan: 0, vlan_qinq: 0, ipv4, proto: 17, 192.168.2.136:3242 -> 239.255.255.250:1900, l7proto: UPnP/UPnP
2) vlan: 0, vlan_qinq: 0, ipv4, proto: 17, 192.168.2.143:17500 -> 255.255.255.255:17500, l7proto: Dropbox/Dropbox
3) vlan: 0, vlan_qinq: 0, ipv4, proto: 17, 192.168.2.143:17500 -> 192.168.2.255:17500, l7proto: Dropbox/Dropbox
4) vlan: 0, vlan_qinq: 0, ipv4, proto: 6, 192.168.2.143:50253 -> 192.168.2.222:22, l7proto: SSH/SSH
5) vlan: 0, vlan_qinq: 0, ipv4, proto: 6, 192.168.2.143:49821 -> 192.168.2.222:22, l7proto: SSH/SSH
6) vlan: 0, vlan_qinq: 0, ipv4, proto: 17, 192.168.2.222:55020 -> 131.114.18.19:53, l7proto: DNS/DNS
7) vlan: 0, vlan_qinq: 0, ipv4, proto: 6, 192.168.2.222:51584 -> 52.30.119.198:80, l7proto: HTTP/HTTP
8) vlan: 0, vlan_qinq: 0, ipv4, proto: 17, 192.168.2.222:46729 -> 131.114.18.19:53, l7proto: DNS/Google

# npcapextract -t /storage/ -b "2016-06-20 17:00:00" -e "2016-06-20 17:15:00" -o /tmp/output.pcap -f "host 192.168.2.222 and l7proto HTTP"
20/Jun/2016 17:17:14 [npcapextract.c:1822] Begin time: 2016-06-20 17:00:00, End time 2016-06-20 17:15:00
20/Jun/2016 17:17:14 [npcapextract.c:1865] 850 packets (845094 bytes) matched the filter in 0.019 sec.
20/Jun/2016 17:17:14 [npcapextract.c:1877] Dumped into 1 different output files.
20/Jun/2016 17:17:14 [npcapextract.c:1899] Total processing time: 0.019 sec.

# tcpdump -nr /tmp/output.pcap | head
reading from file /tmp/output.pcap, link-type EN10MB (Ethernet)
17:12:38.895425 IP 192.168.2.222.51584 > 52.30.119.198.80: Flags [S], seq 891001947, win 29200, options [mss 1460,sackOK,TS val 4205898 ecr 0,nop,wscale 7], length 0
17:12:38.947537 IP 52.30.119.198.80 > 192.168.2.222.51584: Flags [S.], seq 1298651289, ack 891001948, win 17898, options [mss 8961,sackOK,TS val 19396500 ecr 4205898,nop,wscale 8], length 0
17:12:38.947556 IP 192.168.2.222.51584 > 52.30.119.198.80: Flags [.], ack 1, win 229, options [nop,nop,TS val 4205911 ecr 19396500], length 0
17:12:38.947591 IP 192.168.2.222.51584 > 52.30.119.198.80: Flags [P.], seq 1:82, ack 1, win 229, options [nop,nop,TS val 4205911 ecr 19396500], length 81: HTTP: GET / HTTP/1.1
17:12:39.053921 IP 52.30.119.198.80 > 192.168.2.222.51584: Flags [.], ack 82, win 70, options [nop,nop,TS val 19396516 ecr 4205911], length 0
17:12:39.059192 IP 52.30.119.198.80 > 192.168.2.222.51584: Flags [P.], seq 1:1439, ack 82, win 70, options [nop,nop,TS val 19396517 ecr 4205911], length 1438: HTTP: HTTP/1.1 200 OK
17:12:39.059199 IP 192.168.2.222.51584 > 52.30.119.198.80: Flags [.], ack 1439, win 251, options [nop,nop,TS val 4205939 ecr 19396517], length 0
17:12:39.059961 IP 52.30.119.198.80 > 192.168.2.222.51584: Flags [P.], seq 1439:2877, ack 82, win 70, options [nop,nop,TS val 19396517 ecr 4205911], length 1438: HTTP
17:12:39.059966 IP 192.168.2.222.51584 > 52.30.119.198.80: Flags [.], ack 2877, win 274, options [nop,nop,TS val 4205939 ecr 19396517], length 0
17:12:39.112307 IP 52.30.119.198.80 > 192.168.2.222.51584: Flags [.], seq 10997:12445, ack 82, win 70, options [nop,nop,TS val 19396541 ecr 4205939], length 1448: HTTP
You can read more about cento performance and use cases on this blog post or on the Cento User Guide. As a rule of thumb, keep in mind that cento can process 10 Gbit (14.88 Mpps) per core, so with a 4-core CPU as the Intel E3, you can monitor a 40 Gbit link.
Cento is not designed to be a sophisticated flow probe/collector: nProbe is already good at it and cento will not replace it. The idea is that if you need traffic visibility at line rate, with policy enforcement and packet-to-disk recording, then Cento is what you need. If instead you are looking for a sophisticated flow-based probe/collector able to dissect protocols such as VoIP, GTP and HTTP, then nProbe is the tool of choice.
For more information about availability, performance, and the full list of features, we invite you to visit the Cento web page. Awaiting your comments and feedback.