NOTE: this post is outdated. Latest versions of ntopng and nProbe improve performance significantly. New figures are given in this post.
In this post we try to analyze the performance of nProbe and ntopng for the collection of NetFlow. ntopng and nProbe will be broken down into smaller functional units and such units will be analyzed to understand the maximum performance of every single task as well as of the overall collection architecture.
The machine used for the analysis is equipped with an 4-core Intel(R) Xeon(R) CPU E3-1230 v5 @ 3.40GHz with HT and has 16GB of RAM.
To consistently simulate a NetFlow stream and to have the ability to control stream rate, we have recorded some actual NetFlow traffic using tcpdump, and then we’re replayed the recorded traffic with pfsend, that allows to loop-replay (-n 0) the capture and to specify the replay rate (-r <rate>).
$ tcpdump -i eno1 udp and port 2055 -s 0 -w localNetflow.pcap
$ pfsend -i stack:eno1 -f ./localNetflow.pcap -n 0 -r 0.1
nProbe
This is the command we’ve used to analyze nProbe performance:
$ ./nprobe -i none -n none --collector-port 2055 --zmq tcp://127.0.0.1:5556 -b 1 --disable-cache
Using --disable-cache guarantees nProbe will transparently proxy the incoming flows without keeping them into the internal cache.
nProbe NetFlow collection can be summarized as follows:
- Incoming NetFlow is collected by nProbe on an UDP socket
- nProbe dissects NetFlow packets and extract flows carried in them
- Extracted flows are enqueued for the export
- Flows are dequeued to be actually exported via ZMQ or other downstream collectors
The following picture shows a graphical representation of the several steps listed above, and provides information on the maximum rate that can go through each step without drops.
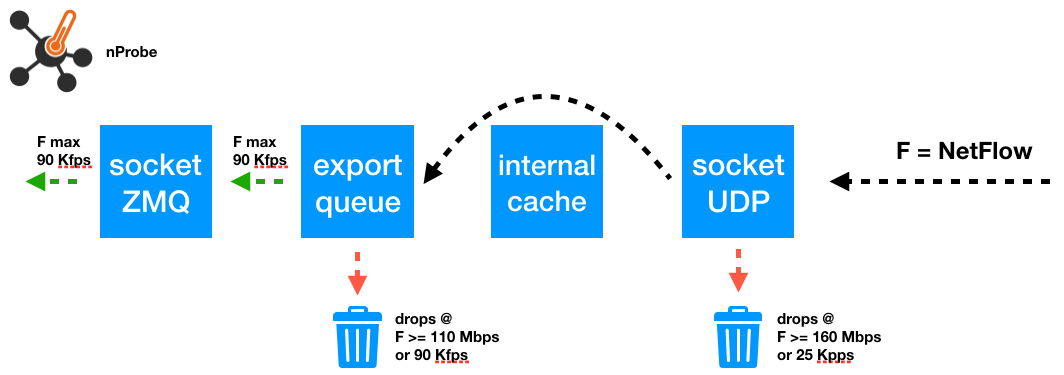
Going above the maximum rate automatically translates into drops. In the following, we will explain how we’ve computed the drops that can occur:
- On the UDP socket when the socket buffer overflows, when the incoming NetFlow rate is higher than the rate at which nProbe reads from the UDP socket
- One the export queue, when the rate at which nProbe enqueues the flows for the export is higher that the rate at which flows are dequeued for the actual export
UDP Socket Drops
To analyze UDP socket drops we have have used pfsend to replay NetFlow traffic at different rates, specified with option -r. We have found that the maximum drop-free rate at which packets can be processed from the UDP socket equals to 160 Mbps or, equivalently, 25 Kpps. To detect drops and find this maximum drop-free rate we have inspected /proc/net/udp to make sure the drop counters was at zero for a sufficiently long time.
This is an example drops experienced in the socket buffers as shown in the latest column and latest row of the following output.
$ cat /proc/net/udp
sl local_address rem_address st tx_queue rx_queue tr tm->when retrnsmt uid timeout inode ref pointer drops
1181: 00000000:0044 00000000:0000 07 00000000:00000000 00:00000000 00000000 0 0 33368 2 ffff8fc0a12d0cc0 0
1224: 00000000:006F 00000000:0000 07 00000000:00000000 00:00000000 00000000 0 0 33007 2 ffff8fc0a12d0880 0
1236: E102A8C0:007B 00000000:0000 07 00000000:00000000 00:00000000 00000000 38 0 31512 2 ffff8fc09ef28880 0
1236: 0100007F:007B 00000000:0000 07 00000000:00000000 00:00000000 00000000 0 0 29241 2 ffff8fc099a18880 0
1236: 00000000:007B 00000000:0000 07 00000000:00000000 00:00000000 00000000 0 0 29235 2 ffff8fc099a18000 0
3168: 00000000:0807 00000000:0000 07 00000000:00068100 00:00000000 00000000 1006 0 1122119 2 ffff8fc08466bfc0 260932
Export Queue Drops
To analyze export queue drops, we have used nProbe output when run with option -b 1 to observe the “export queue full” errors and the queue fill level. The relevant output is the following
19/Dec/2018 15:07:01 [nprobe.c:3351] Flow drops: [export queue full=44524035][too many flows=0][ELK queue flow drops=0]
19/Dec/2018 15:07:01 [nprobe.c:3356] Export Queue: 511980/512000 [100.0 %]
The export queue full counter is incremented by one every time a flow is dropped as the export queue is full. We have been able to quantify the maximum drop-free rate at which flows can enter and leave the queue without drops in 90 Kfps, that is, approximately 110 Mbps of NetFlow traffic, produced with pfsend as follows
$ sudo pfsend -i stack:eno1 -f ./localNetflow.pcap -n 0 -r 0.11
90 Kfps is also the maximum drop-free rate at which nProbe can operate without drops to collect NetFlow and export it via ZMQ.
ntopng
ntopng has been set up to receive flows via ZMQ as follows
./ntopng -i tcp://127.0.0.1:5556 -m "192.168.2.0/24" --dont-change-user --disable-login 1
ntopng flows processing can be summarized as follows:
- Flows are received via ZMQ
- ZMQ JSON messages content is parsed to reconstruct the flows
- Reconstructed flows are added to the ntopng internal cache for further processing
The following picture shows a graphical representation of the several steps listed above, and provides information on the maximum rate that can go through each step.
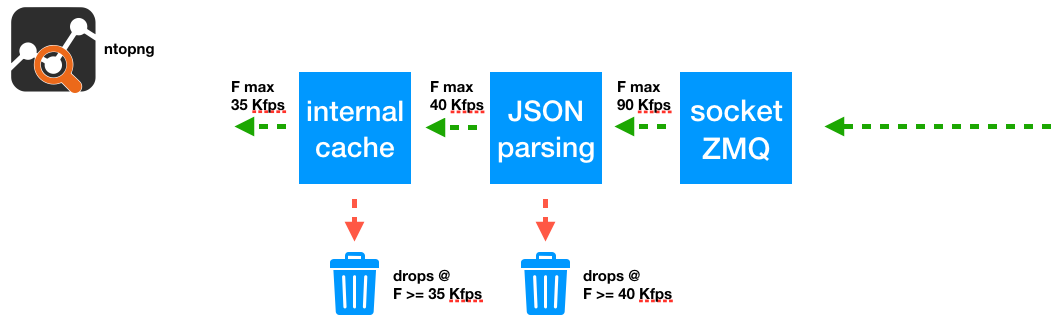
We have experienced that, without JSON parsing and internal cache processing, ntopng is able to collect flows from nProbe at 90 Kfps. However, when we’ve enabled the JSON parsing and the internal cache, necessary for ntopng to properly work, we have experienced a lower maximum drop free rate.
Specifically, enabling the JSON parsing alone, without any internal cache, brings the maximum processed flows per second down to 40 Kfps. Enabling also the internal cache costs another 5 Kfps, resulting in a maximum drop-free rate of 35 Kfps. This maximum drop-free rate can be obtained with pfsend with a rate of 40 Mbps
$ sudo pfsend -i stack:eno1 -f ./localNetflow.pcap -n 0 -r 0.04
Conclusion
When nProbe is not used in combination with ntopng, it can collect and export flows over ZMQ at a rate of 90 Kfps per interface, corresponding to NetFlow rate of 110 Mbps.
When nProbe is used in combination with ntopng, the maximum number of flows per second that can be processed without drops is 35 Kfps, corresponding to a NetFlow rate of 40 Mbps.
If you need to scale up, you just need to start multiple nProbe’s that send flows to multiple ntopng collector interfaces. That’s so simple!