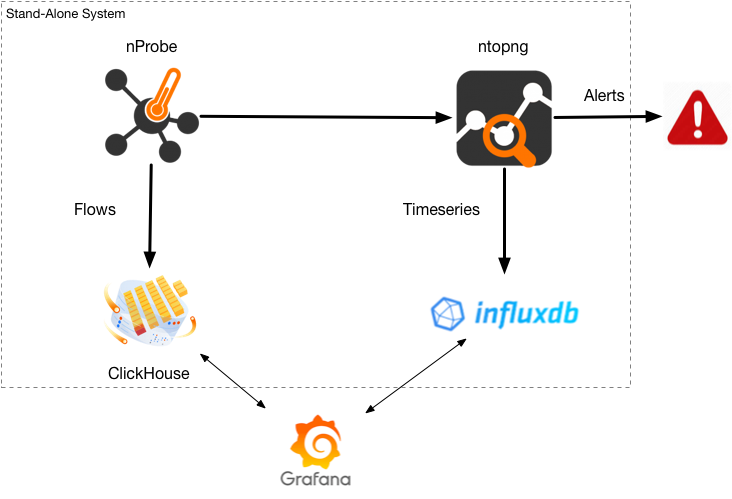
In our previous post we have analysed the performance of the pipeline nProbe+ntopng for those who need to collect flows and analyse them, trigger alerts, create timeseries, provide a realtime monitoring console, dump them to nIndex and inform remote recipients in case of some problem is detected. This is the main difference between the ntop solution and a NetFlow collector whose main goal is to dump flows on a database with any or little flow analysis. In essence the current state of the art with 4 nProbe instances sending data to a single ntopng instance is a process rate of ~100k flows/second.
In this post we analyse the performance of nProbe alone, so that you can make up your mind if:
- You only need to collect flows and dump them on disk or on a database.
- You want to create a distributed collection architecture where you have multiple collection points and you need to know how fast you can scale.
Goal of this article is to show you the various options we can offer you in terms of flow collections and processing, and show you that maximum performance you can achieve on a single stand-alone system (no clustering or multi-node deployment) when collecting hundred of thousand flows/sec and dumping them on a open-source database able to store trillion of records and retrieve them with sub second queries.
nProbe: How to Dump Flows Into ClickHouse
One of the new features of the recent nProbe dev builds is the ability to dump flows in ClickHouse, a column-oriented database able to scale to hundred of billion or records/node using a single node and no more than 16 GB or RAM regardless of the number of records. The nice thing about ClickHouse is that you can both access this database using the native client (as nProbe does for importing data) or as a MySQL database listening on port 9004 (MySQL default port is 3306). As ClickHouse is integrated with Grafana, you can easily create dashboards with a few clicks if you want. Currently ClickHouse support is integrated in the nProbe Enterprise M and up versions (not available on Windows), and it will be integrated in the next stable nProbe release due by the end of this month. Similar to MySQL, you can enable ClickHouse in nProbe with:
--clickhouse=<host[@port]>:<dbname>:<prefix>:<user>:<pw>
Example if you have a the same box nProbe and ClickHouse running you can start nProbe as
nprobe --clickhouse=127.0.0.1:ntop::default:helloworld
where ntop is the database name, default is the ClickHouse username with password helloworld. nProbe stores temporary data (used to batch data for ClickHouse import) in the directory specified with -P or on a temporary directory if -P is not specified.
As already said, once your data is on ClickHouse you can query it using mysql client or the native client as follows:
clickhouse-client --password xxxxxxx
ClickHouse client version 21.7.3.14 (official build).
Connecting to localhost:9000 as user default.
Connected to ClickHouse server version 21.6.5 revision 54448.

ClickHouse server version is older than ClickHouse client. It may indicate that the server is out of date and can be upgraded.

pc-ntop :) use ntop

USE ntop

Query id: 8c8d9ea5-5396-41ee-a648-3524c3c22add

Ok.

0 rows in set. Elapsed: 0.001 sec.

pc-ntop :) select count(*) from flows where IPV4_SRC_ADDR = IPv4StringToNum('192.168.0.1')

SELECT count(*)
FROM flows
WHERE IPV4_SRC_ADDR = IPv4StringToNum('192.168.0.1')

Query id: ce8c8375-aa35-4f94-a1ca-9a09d891902d

┌───count()─┐
│ 110894877 │
└───────────┘

1 rows in set. Elapsed: 0.035 sec. Processed 110.90 million rows, 443.58 MB (3.19 billion rows/s., 12.76 GB/s.)

pc-ntop :) Bye.
In a future ntopng version we will eventually add support for querying data directly from ntopng.
nProbe Performance
Below you can find a table with the nProbe performance we have measured on a Ubuntu 18.04 system based on Intel E3-1241 and a SSD drive where data is stored. In order to measure that maximum nProbe performance we have added a new testing CLI option named –simulate-collection that simulates infinite flow ingress collection so that we can measure the worst case with randomly generated flows. The base command line option we have used (it needs to be slightly adapted according to the test case) is
nprobe -b 1 –simulate-collection -t 10 -n none –clickhouse=127.0.0.1@9004:ntop::default:XXXXX -T “%IPV4_SRC_ADDR %IPV4_DST_ADDR %INPUT_SNMP %OUTPUT_SNMP %IN_PKTS %IN_BYTES %FIRST_SWITCHED %LAST_SWITCHED %L4_SRC_PORT %L4_DST_PORT %TCP_FLAGS %PROTOCOL %SRC_TOS %SRC_AS %DST_AS %EXPORTER_IPV4_ADDRESS %IPV6_SRC_ADDR” -P /tmp/ramdisk/
As you can see flows are dumped to /tmp/ramdisk/ (created with sudo mount -t tmpfs -o size=5G myramdisk /tmp/ramdisk) before are batch imported into ClickHouse that is running on the same host where nProbe runs.
Below you can find the results of all test cases:
| Test Case (Single nProbe Instance) | Measured Performance Fps (Flows/sec) |
|---|---|
| nProbe dumping to ClickHouse, no NetFlow Export | 125 Kfps |
| nProbe with NetFlow Export only | 300 Kfps |
| nProbe speaking to ntopng via ZMQ, no NetFlow Export | 183 Kfps |
| nProbe dumping to ClickHouse, speaking to ntopng via ZMQ, no NetFlow Export | 77 Kfps |
| nProbe dumping to ClickHouse, speaking to ntopng via ZMQ, with NetFlow Export | 74 Kfps |
The above figures are per nProbe instance, so you can run multiple nProbe instances for maximising performance. In our tests with a local ClickHouse database, we can import up to 150k Fps with two nProbe instances that seems to be the maximum a single ClickHouse database can handle.
As a final note you can see, the figures above exceed the nProbe+ntopng performance of 100k Fps, but it is hard to compare them 1:1 as:
- nProbe+ClickHouse is just collecting flows and storing them on a high-performance MySQL-compatible database, as most collectors on the market do. No data analysis, alerting or traffic timeseries are created.
- nProbe+ntopng is a complete NetFlow traffic solution, with data analysis, anomaly detection, traffic behaviour analysis, timeseries etc.
So depending on what are your requirements you can choose one or the other. Note that you can use nProbe+ClickHouse+ntopng for the best of both worlds. We believe it is a great achievement to be able to collect, analyse and dump over 100k flows/sec on a single host with no need to create a cluster of database instances (necessary for instance if you want to dump flows with nProbe/ntopng into Elastic) or costly systems to both build and maintain.
Enjoy !