Most ntop tools such as nProbe cento and n2disk have been designed to run at high speed (today we consider 100 Gbit a high-speed link). ntopng instead has to perform many activities including behavioral traffic analysis that makes it unable to process traffic well above 10 Gbit. In this case you can use nProbe Cento to send ntopng (preprocessed) flows and you can monitor 100 Gbit networks without dropping a single packet.

In the above picture ntopng can handle 25k-50k flows/sec per interface (the exact figure depends on the hardware system you are using). With a single ClickHouse instance we are able to ingress (in our low-end Intel E3 system) up to 100k flows/sec, so a multi-collector interface ntopng can saturate a single ClickHouse server and have slow-downs if making many queries while inserting data.
For this reason we have recently enhanced ClickHouse support (in dev branch that soon will become stable) in order to support the following topology:
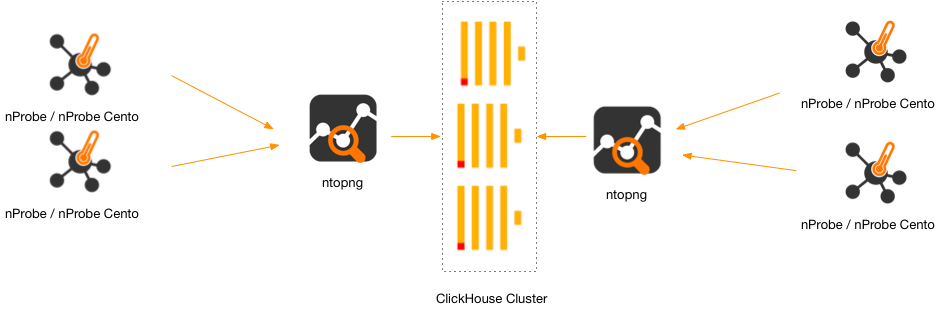
In essence we can now deploy multiple ntopng instances writing to:
- A single/stand-alone ClickHouse instance.
- A ClickHouse cluster. You can read more here about configuring a ClickHouse cluster and using it from ntopng.
A ClickHouse cluster can provide (depending on its configuration, number of nodes and network speed) redundancy, capacity (several billion records accessed instantaneously), and performance. With this ntopng enhancement, it is possible to scale up with flow collection/analysis as we have designed an architecture where the main configuration problem is to distribute the load across all the ntopng instances, as everything else will scale automatically.
nProbe can natively distribute flows across multiple ZMQ connections or using Kafka, so you need to make sure that you are configuring your flow-exporter devices in order to distribute flows across all the available nProbe collectors. When this is not possible and all flows are sent towards the same collector IP:port, the nProbe package contains a too named nfFanout that is designed to handle hundred of thousand flows/sec.
$ nfFanout
Copyright (C) 2010-23 ntop.org
Usage: nfFanout -c <port> -a <collector IPv4:port> [-a <collector IPv4:port>]*
               [-v] [-V] [-r] [-h]
  -c <port>              | UDP port where incoming flows are received
  -a <collector IP:port> | Address:port where to send collected flows to
  -r                     | Use round-robin instead of fan-out
  -v                     | Enable verbose logging
  -V                     | Show application version
  -h                     | Print this help

  Example: nfFanout -c 2055 -a 192.168.0.1:1234 -a 192.168.0.2:1234
This tool solves two problems:
- High-Availability: when used in fanout-mode it can replicate the collected flow by sending it to multiple destinations.
- Load-Balancing: when used in round-robin mode it can distribute collected across multiple nProbe instances without reconfiguring flow exporters whenever you want to change the number and location (i.e. the IP address of the server where nProbe runs) of the nProbe instances.
Remember that if you just want to collect flows with no analysis or visualisation whatsoever, you can directly egress flows from nProbe to ClickHouse if necessary.
So now you know how to handle hundred of thousand flows/sec, visualise them and produce behavioural alerts.
Enjoy !