nProbe is both a probe and a NetFlow/sFlow collector. Recently, we’ve also added added the ability to collect flows with proprietary information elements. This greatly improves nProbe flexibility as any custon, vendor-proprietary information element can be understood, correctly parsed, and exported downstream.
Adding proprietary information elements to nProbe is a breeze. Indeed, it suffices to use a plain-text file with the elements description. That’s all. Once the fields have been loaded from the plain-text file, they can be treated as if they were regular fields. So for example they can be added to the nProbe template -T to have them exported to Kafka, ntopng, text files, or any other supported downstream store.
We maintain and make publicly available several plain-text files that contain elements descriptions for several vendors, including Cisco, Gigamon and Sonicwall. Those files can be fetched at https://github.com/ntop/nProbe/tree/master/custom_fields.
In this article we show how to properly configure nProbe to collect Sonicwall flows. However, the methodology described here is general and can be applied, mutatis mutandis, to any other vendor. It is also shown how the collected data can be visualized with ntopng.
Configuring nProbe
As anticipated above, nProbe needs a plain-text file with the elements description to understand Sonicwall proprietary fields. This file is available at https://github.com/ntop/nProbe/blob/master/custom_fields/Sonicwall/sonicwall_custom_fields.txt. Download the file somewhere in the filesystem (make sure to download it using the “raw” link) as you’ll have to feed it to nProbe using option --load-custom-fields.
Now, for the sake of example, let’s assume:
- One or more Sonicwall devices are exporting IPFIX with Extensions to the host running nProbe on port 2055.
- Collected IPFIX with Extensions flows have to be sent to ntopng for the visualization via ZMQ on port 5556.
- The file
sonicwall_custom_fields.txthas been downloaded to/etc/nprobe/.
According to the assumptions above, the configuration file for nProbe can be the following
--collector-port=2055
-n=none
-i=none
--load-custom-fields="/etc/nprobe/sonicwall_custom_fields.txt"
--zmq="tcp://127.0.0.1:5556"
--zmq-probe-mode=
-T="@NTOPNG@ %FLOW_TO_APPLICATION_ID %FLOW_TO_USER_ID %FLOW_TO_IPS_ID %IF_STAT_IF_NAME %IF_STAT_IF_TYPE %IF_STAT_IF_SPEED"
In the example, only a limited number of information elements (those listed in the template) is actually exported to ntopng. As you can see, they are treated as if they were regular fields.
That’s pretty much all for nProbe. Everything is set up for the collection of Sonicwall flows. Let’s now have a look at ntopng for the visualization as there’s a juicy bonus here, that is, the ability to visualize pie charts of proprietary Sonicwall application ids and signatures.
Data Visualization with ntopng
In terms of configuration, nothing changes on the ntopng side. To collect flows coming from nProbe on port 5556, the minimum configuration needed for ntopng is a one-liner
--interface="tcp://127.0.0.1:5556c"
Start ntopng to have Sonicwall flows beautifully shown inside ntopng, along with their custom fields defined in the template.
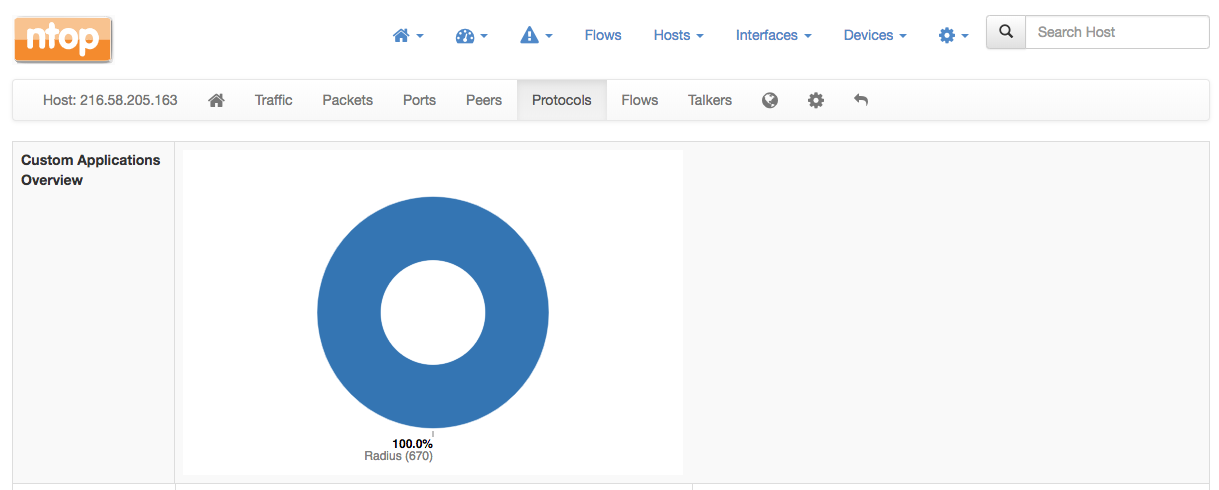
There is also a pie chart with proprietary Sonicwall applications available both at the level of interface as well as for every host. This extra pie chart will automatically appear on the top of the Protocols page.

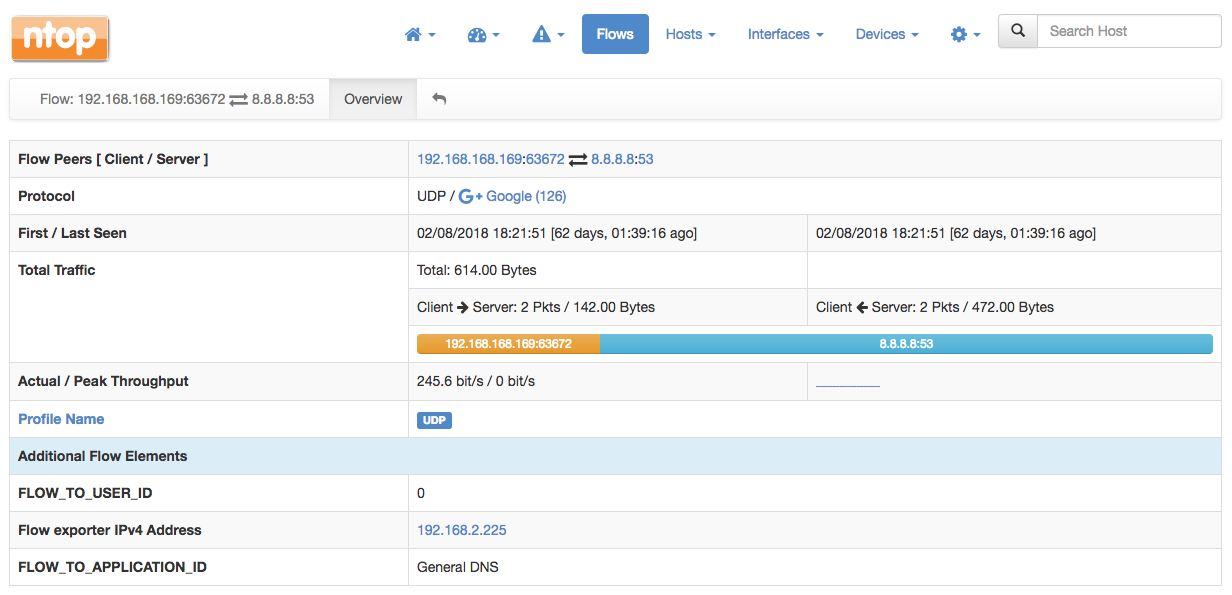
In addition, all the custom fields will appear in every flow details page. For example, the UDP flow below has been detected as General DNS by Sonicwall. ntopng augments this information by telling you that that is a Google flow, but is also show the Sonicwall-detected application untouched inside the Additional Flow Elements.