Creating Grafana dashboards out of ntopng data basically boils down to:
- Configuring ntopng to export timeseries data to InfluxDB
- Configuring the Grafana InfluxDB datasource to extract timeseries data from InfluxDB
- Adding Grafana Dashboards panels with ntopng data
This post aims at covering the topics above to serve as reference for those who want to create Grafana dashboards.
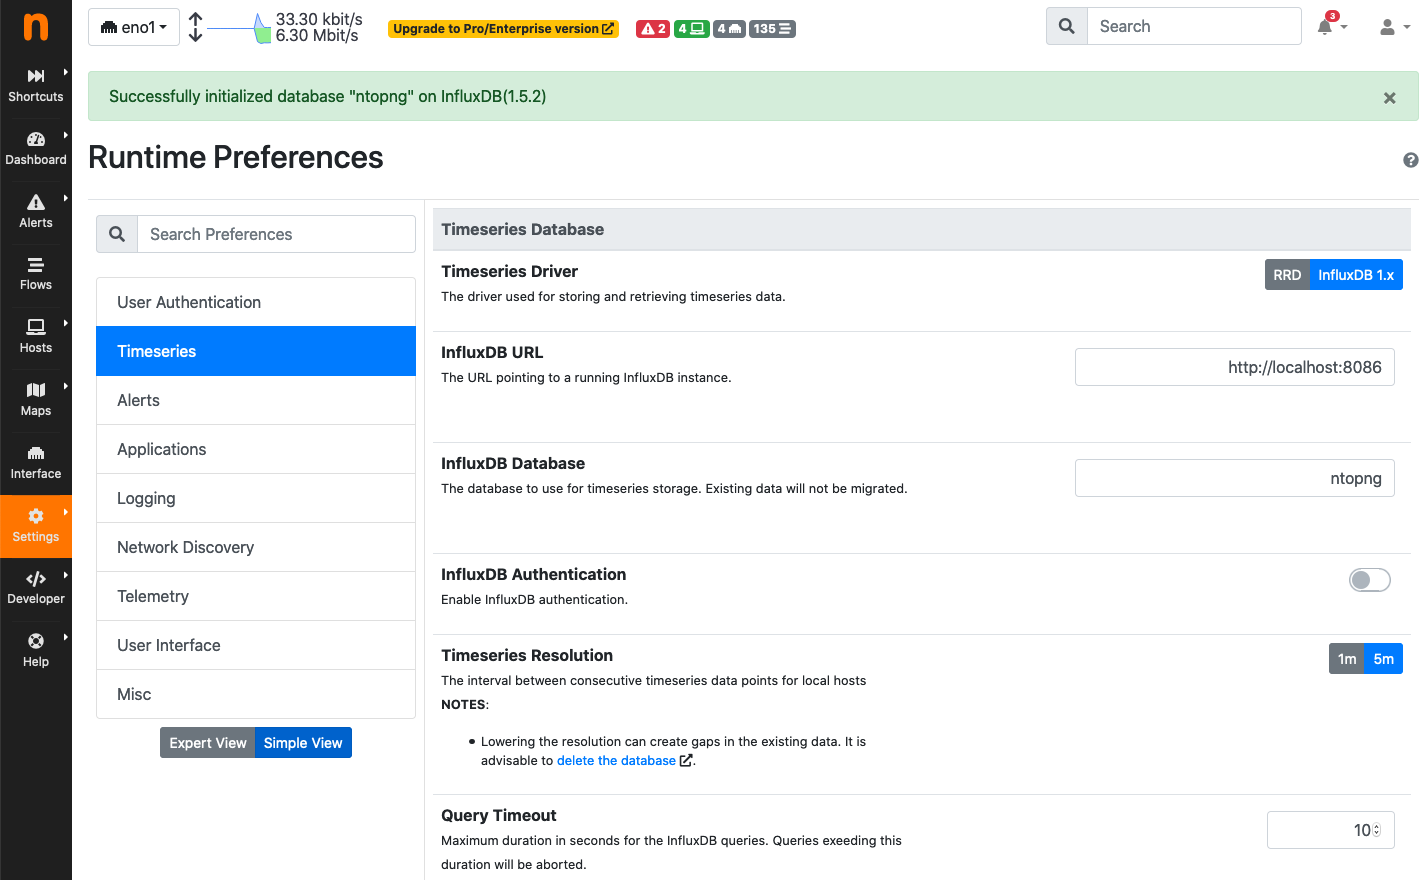
Configuring ntopng to Export Timeseries Data to InfluxDB
To configure ntopng to export timeseries data to InfluxDB, visit the ntopng Timeseries preferences page, and pick InfluxDB as driver. Then, it suffices to configure InfluxDB connection parameters. Once preferences are saved, ntopng will start exporting timeseries data to InfluxDB.
Configuring the Grafana InfluxDB Datasource
The same InfluxDB connection parameters specified above to configure ntopng can be used also to create a Grafana InfluxDB datasource. To create the datasource, pick the Datasources entry under the Grafana configuration menu, and add a new datasource of type InfluxDB. Then, it is enough to specify InfluxDB connection parameters.
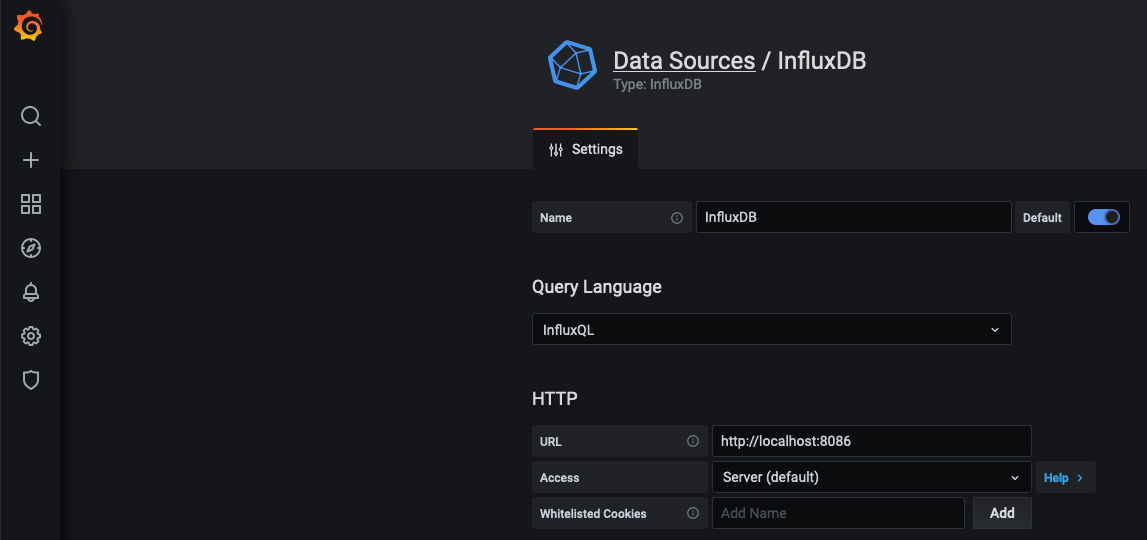
Clicking on “Save & Test” will automatically test the connection and save it.
NOTE: The Grafana ntopng plugin datasource is outdated and should not be used.
Adding Grafana Dashboards panels with ntopng data
Now that Grafana is properly set up to extract timeseries data from InfluxDB, new panels with ntopng timeseries data can be added to dashboard panels.
Timeseries data are added to panels using the Grafana query builder. The query builder helps constructing the classical SELECT-FROM-WHERE clauses to pick the right data.
Different queries need to be constructed, depending on whether a gauge or a counter is being charted. Gauges and counters are the two types of timeseries exported by ntopng:
- Gauge are for things like the number of active flows, or active hosts
- Counters are for continuous incrementing values such as bytes sent and received
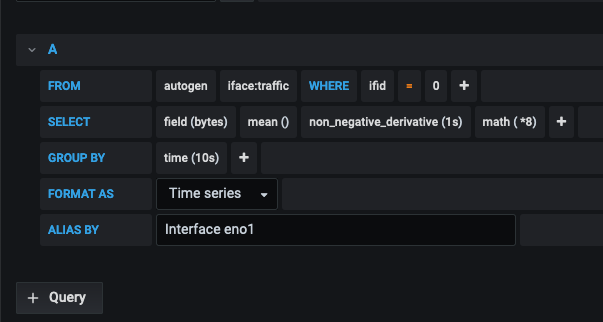
Gauges
Likely, to chart a gauge, a query will have to take the non_negative_derivative. Indeed, continuous incrementing values are only meaningful when derived, that is, when compared with their adjacent values. For the sake of example, a gauge panel with interface traffic can be created as follows.
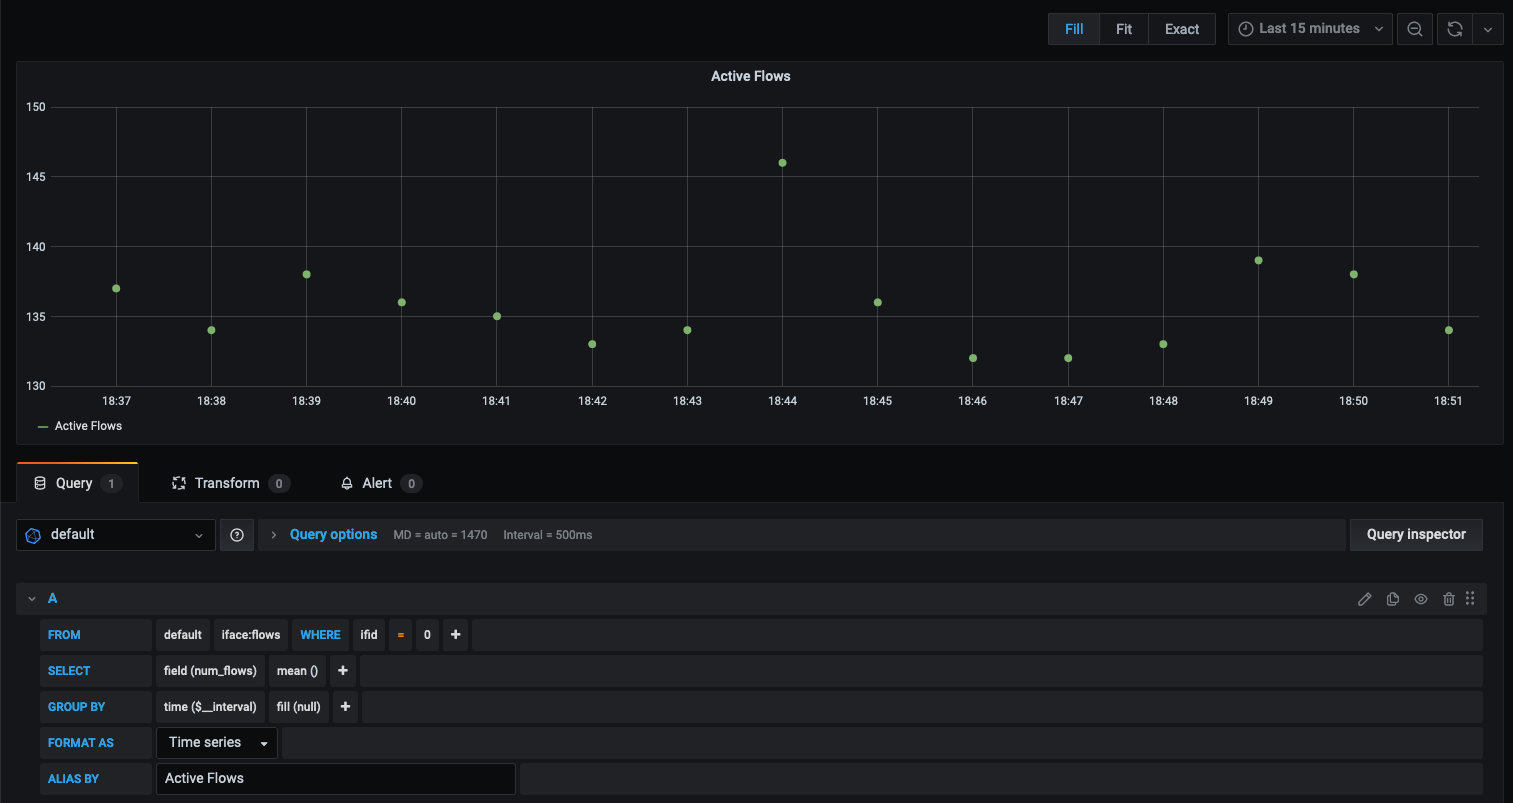
Counters
To chart counters, there is no need to take the derivative. Data can be taken as-is. For example, one can create a panel with the number of active flows for an interface as follows.
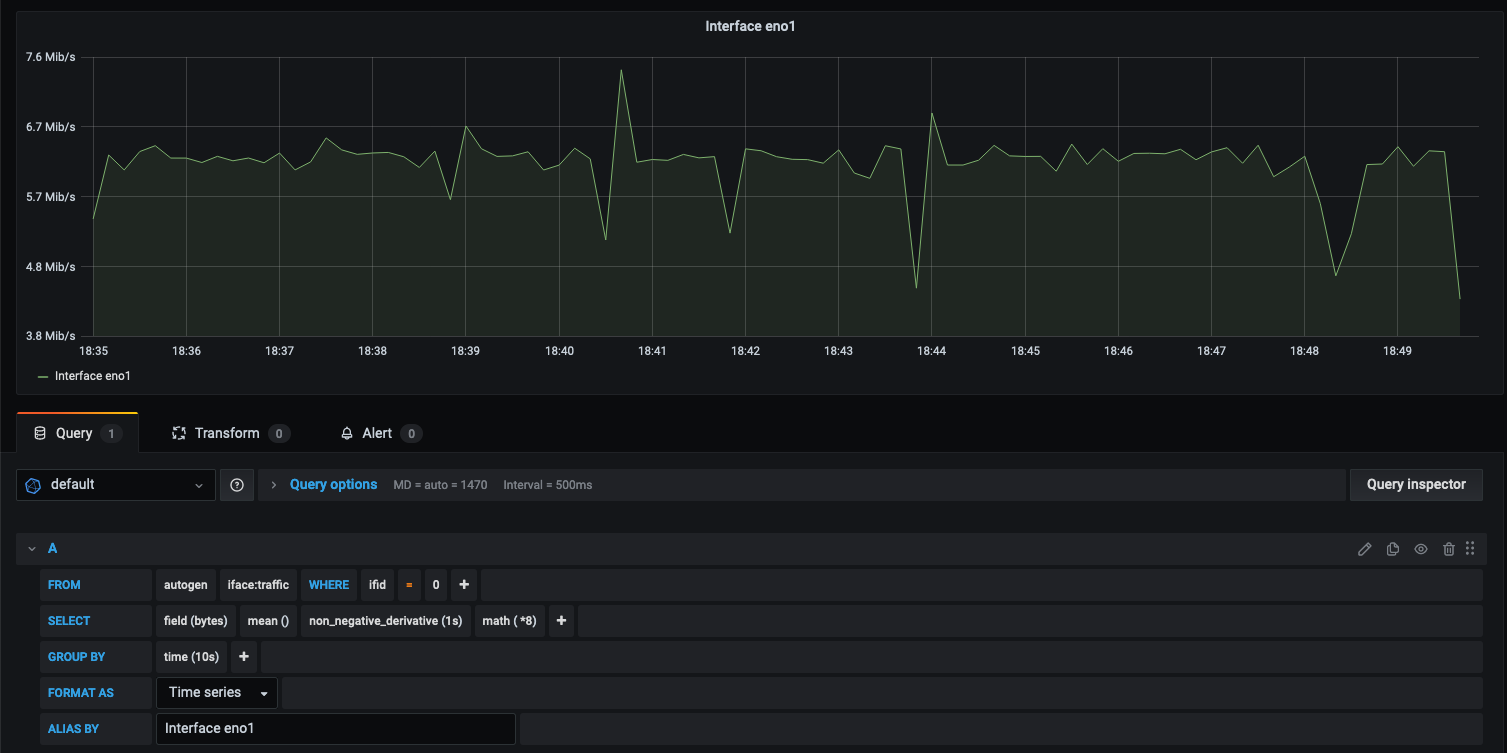
A Complete Dashboard
A complete yet basic dashboard can look like the following.
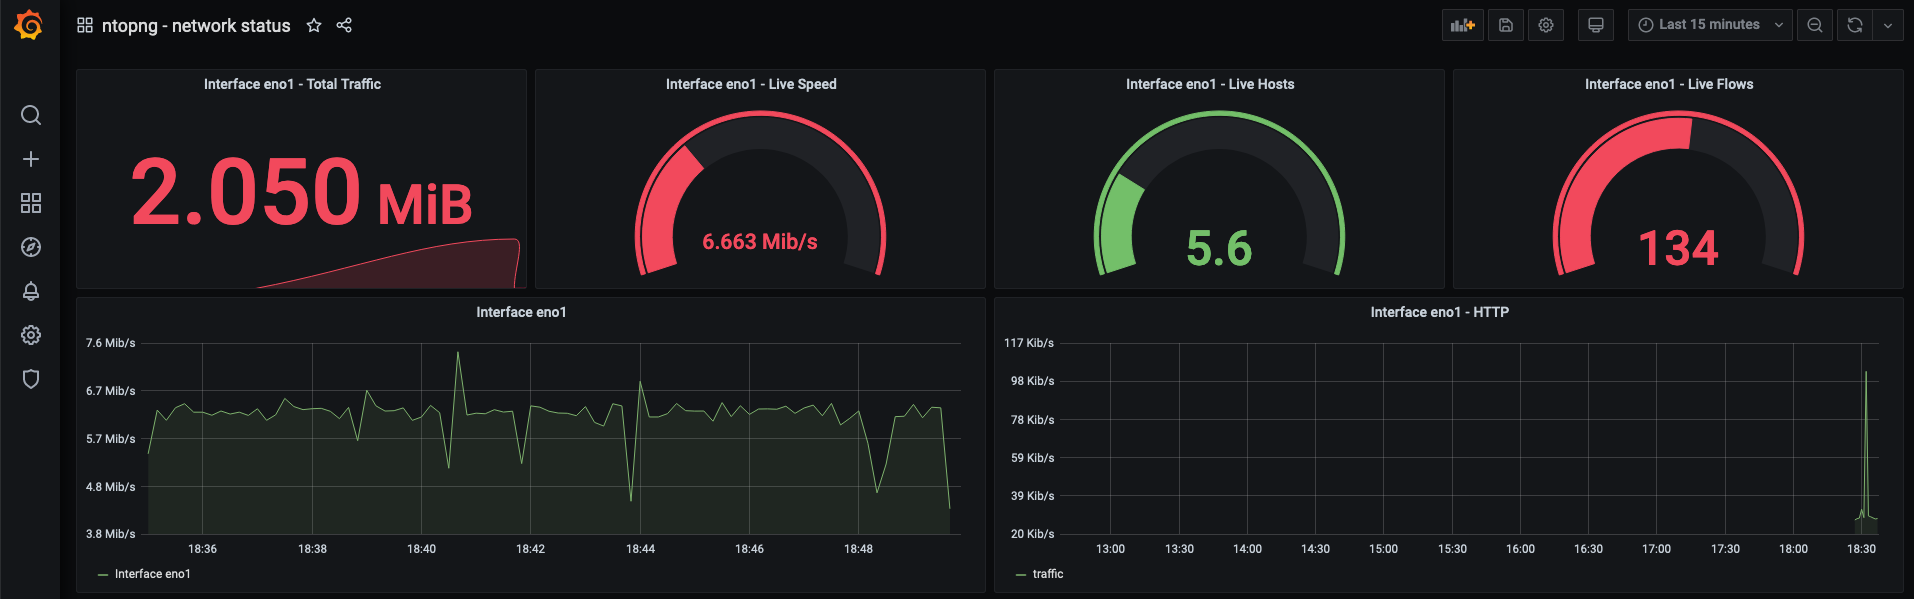
The dashboard can be downloaded in JSON format from this link.
Enjoy !