Disclaimer
This article is outdated: please see this document for using ntopng with grafana
Summary
- Grafana is one of the most widely known platforms for metrics monitoring (and alerting);
- ntopng version 3.1 natively integrates with Grafana thanks to a datasource plugin which is freely available;
- This article explains how to install and configure the ntopng datasource plugin, and how to build a dashboard for the visualization of ntopng-generated metrics.
- A video tutorial is available as well:
Introduction
Grafana is an open platform for analytics and visualization. An extremely-well engineered architecture makes it completely agnostic to the storage where data resides. This means that you can build beautiful dashboards by simultaneously pulling points from data sources such as ntopng, MySQL and Influxdb, just to name a few. Grafana interacts with tens of different data sources by means of datasource plugins. Those plugins provide a standardized way to deliver points to Grafana. ntopng implements one of those datasource plugins, to expose metrics of monitored interfaces and hosts, including throughput (bps and pps) and Layer-7 application protocols e.g., (Facebook, Youtube, etc).
Exposed Metrics
ntopng exposes metrics for monitored interfaces as well as for monitored hosts. Each metric is identifiable with a unique, self-explanatory string. In general, interface metrics are prefixed with the string interface_ while host metrics are prefixed with the string host_. Similarly, a suffix indicates the measurement unit. Specifically, _bps and _pps are used for bit and packet rates (i.e., the number of bits and packets per second), whereas _total_bytes and _total_packets are used for the total number of bytes and packets over time, respectively.
Currently, supported metrics carry traffic as well as Layer-7 application protocols metrics.
Traffic metrics exposed are:
interface_<interface name>_traffic_bpsinterface_<interface name>_traffic_total_bytesinterface_<interface name>_traffic_ppsinterface_<interface name>_traffic_total_packetshost_<host ip>_interface_<interface name>_traffic_bpshost_<host ip>_interface_<interface_name>_traffic_total_bytes
Layer-7 application protocol metrics exposed are:
interface_<interface_name>_allprotocols_bpshost_<host ip>_interface_<interface_name>_allprotocols_bps
To be able to use the aforementioned metrics inside Grafana dashboards, the ntopng datasource plugin must be installed and configured as explained below.
Configuring the ntopng Datasource
Prerequisites
- A running instance of Grafana version 4 or above;
- A running instance of ntopng version 3.1 or above.
Grafana and ntopng run on Linux and Windows, either on physical, virtualized or containerized environments. For Grafana installation instructions see Installing Grafana. ntopng can either be built from source, or installed as a package.
Installing the ntopng Datasource Plugin
Installing the ntopng Datasource plugin is as easy as
$ grafana-cli plugins install ntop-ntopng-datasource
Upon successful installation, you will receive a confimation message and you will have to restart Grafana
installing ntop-ntopng-datasource @ x.y.z
from url: https://grafana.com/api/plugins/ntop-ntopng-datasource/versions/x.y.z/download

Installed ntop-ntopng-datasource successfully

Restart grafana after installing plugins .
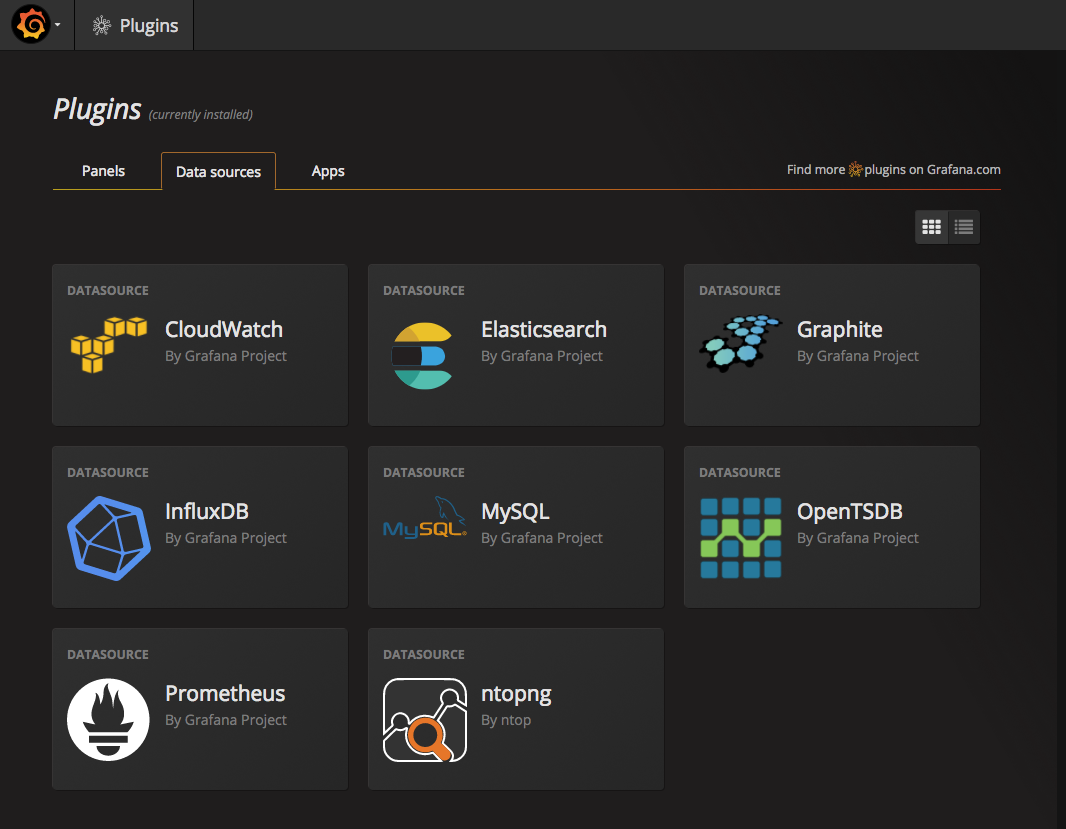
After restarting Grafana, you can connect to its web User Interface (UI) and visit the Plugins page. ntopng will be listed under the datasources tab.
Configuring the ntopng Datasource
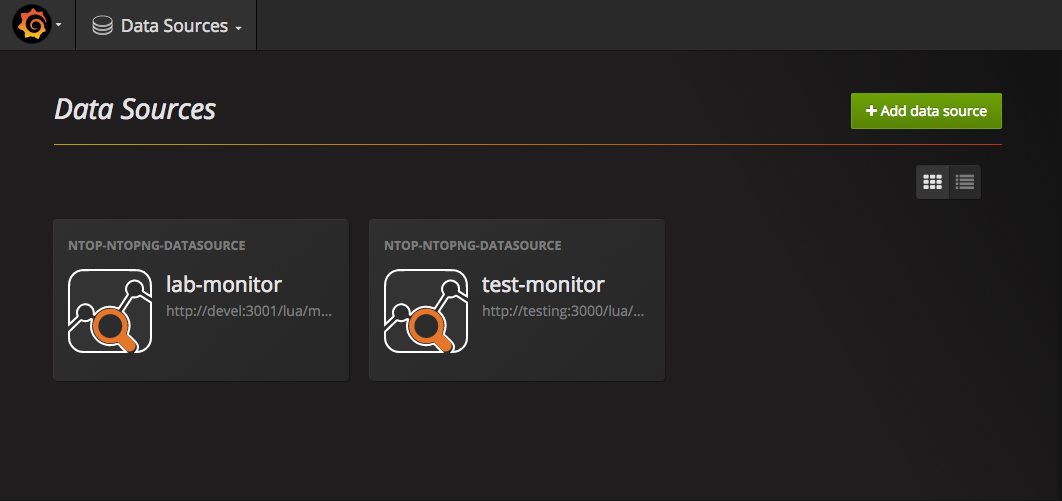
A new datasource with type ntopng will be available once the ntopng datasource plugin is installed. Multiple ntopng datasources can be created to connect to several running ntopng instances. The list of configured datasources is available at the Grafana ‘Data Sources’ page. The following image shows two ntopng datasource configured with the aim of connecting to two different ntopng instances running on separate machines.
Adding a new ntopng datasource is a breeze. Just hit the ‘+ Add datasource’ button inside the Grafana ‘Data Sources’ page. This will open an ‘Edit Data Source’ page that can be used to specify ntopng connection parameters.
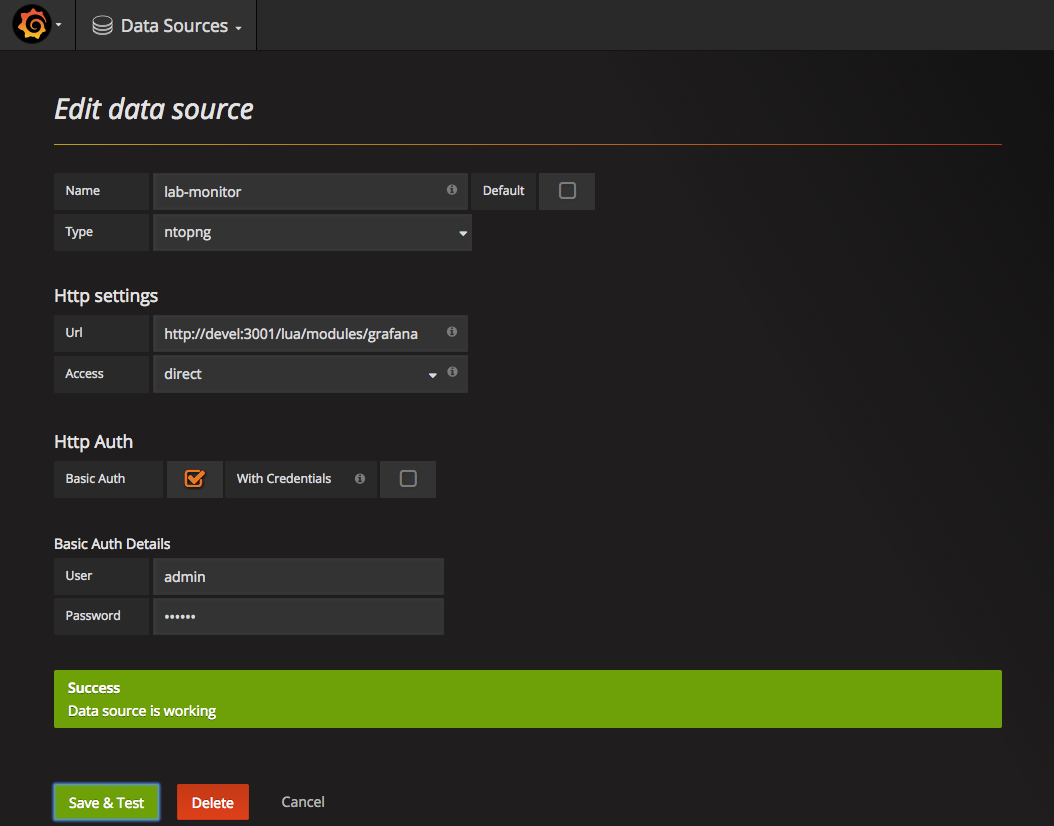
To configure the ntopng datasource select ntopng as the datasource Type and give it a mnemonic Name that will help you identifying the datasource connection. The Url in the HTTP settings must point to a running ntopng instance, to the endpoint /lua/modules/grafana. For example, to connect to an ntopng running on host devel on port 3001, you have to use url http://devel:3001/lua/modules/grafana.
The Access method must be set to direct. Tick Basic Auth if your ntopng instance has authentication enabled and specify a username-password pair in fields User and Password. The pair must identify an ntopng user. Leave the Basic Auth checkbock unticked if ntopng has no authentication (--disable-login).
Finally, hit the button Save and Test to verify the datasource is working properly. A green message Success: Data source is working will appear to confirm the datasource is properly set up.
The following screenshot highlights the connection to an ntopng instance running on host devel on port 3001.
Building a Dashboard
Once the datasource is properly set up, you can visualize ntopng timeseries in any of your Grafana dashboards. Dashboards are flexible ensembles of panels. Each panel is meant to visualize a single timeseries. Panels are added in any dashboard by clicking on the ‘Add Row’ button that will allow you to choose among the available panel types.

Currently, ntopng provides timeseries that can be used effectively to build ‘Chart’ and ‘Singlestat’ panels.
Adding an Interface Speed Panel
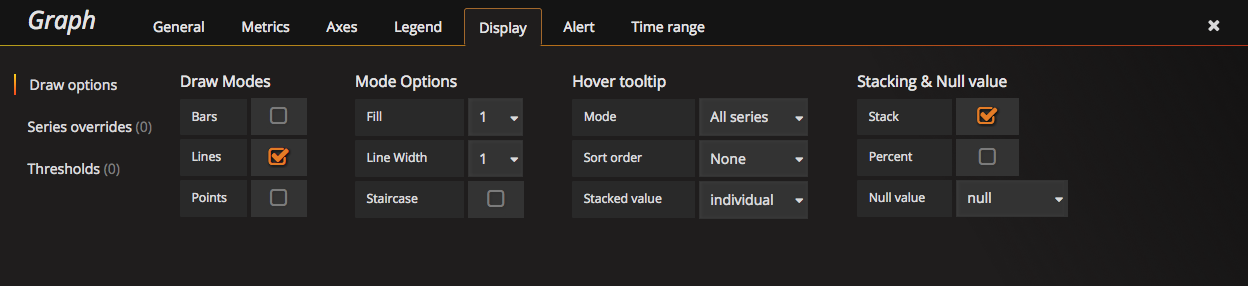
To add an interface speed panel, select ‘Graph’ in the available panel types. A graph panel with random data will be automatically added to the dashboard. Click on the ‘Panel Title’ and select ‘Edit’. A configuration page as the following will appear:
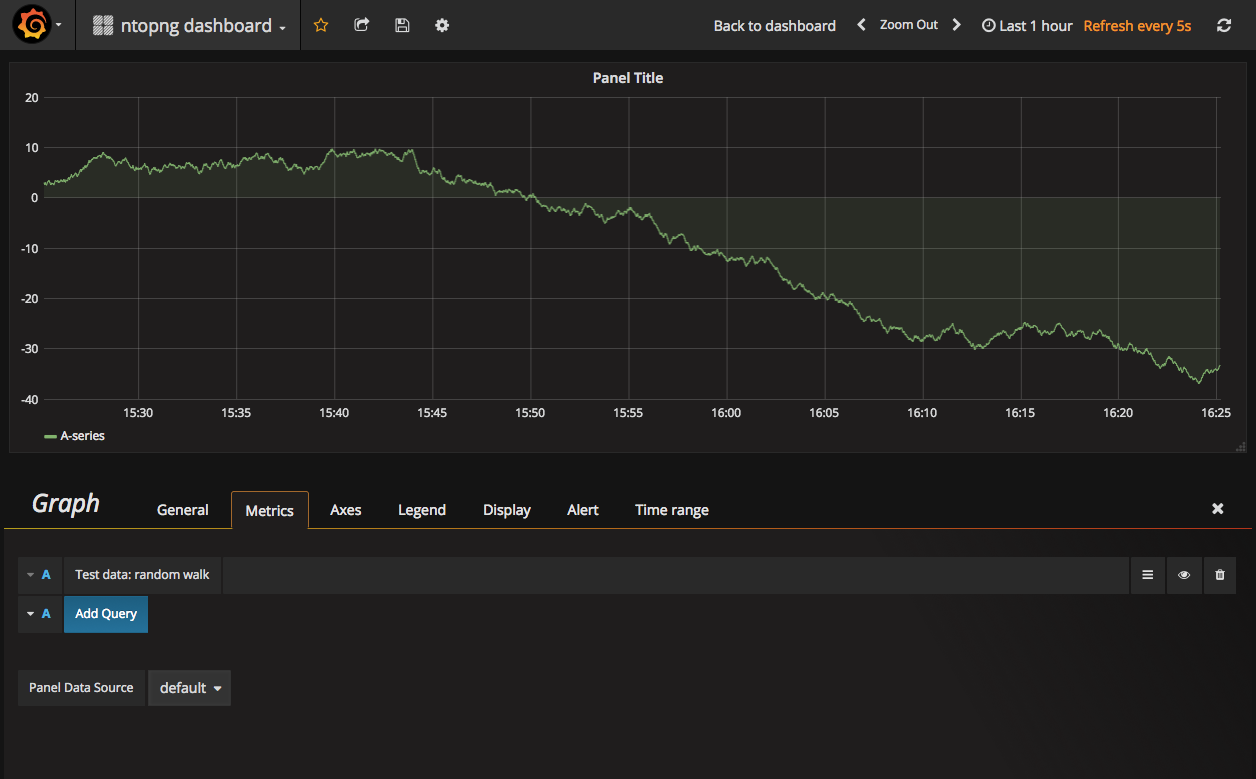
There is a ‘Test data: random walk’ timeseries with random data by default. Drop it by clicking on the bin. To add ntopng metrics select one of the ntopng datasources configured from the ‘Panel Data Source’ dropdown. In the following image, an ntopng datasource named lab-monitor is selected:
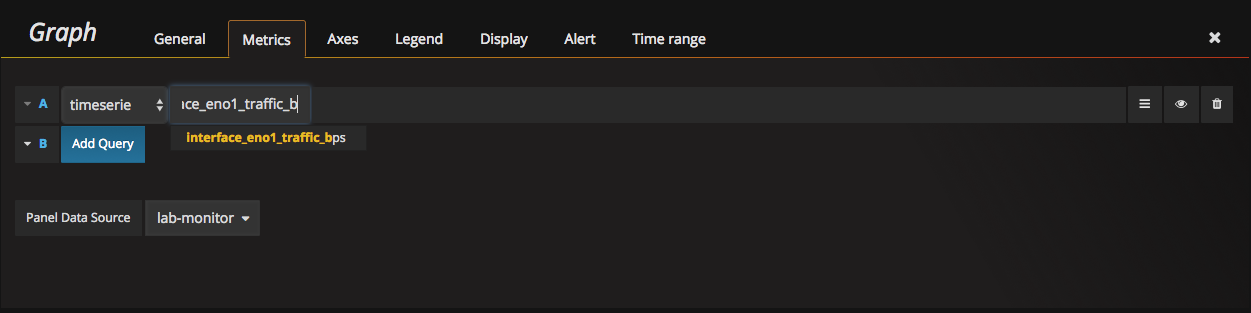
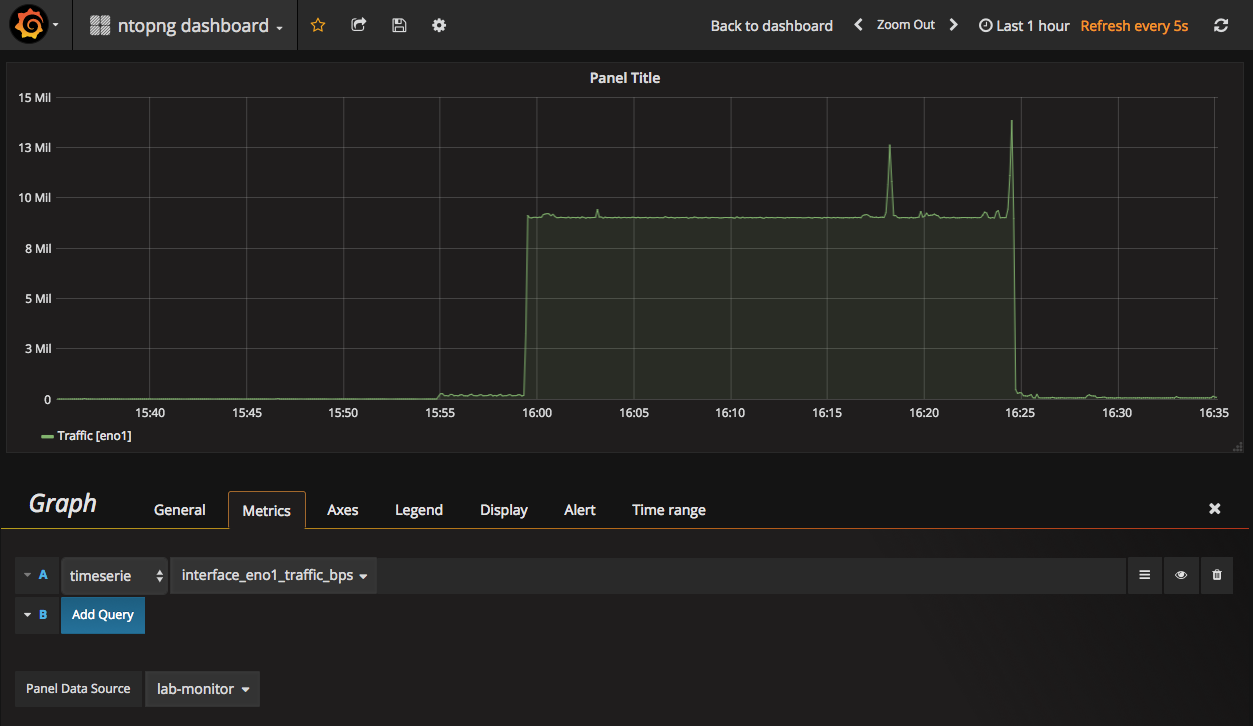
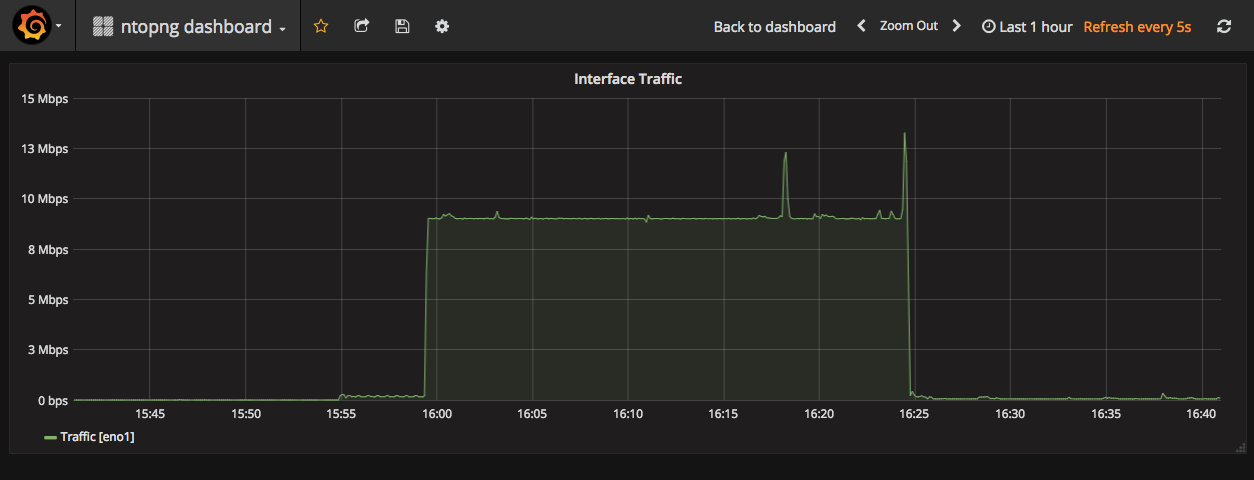
Once the datasource is selected, you can click the ‘Add query’ button and start type a metric name. Autocompletion will automatically show all the available metrics matching the typed text. In the image above, interface eno1 bps is picked among all timeseries available. As soon as the metric is chosen, a chart will be populated. However, as shown below, the chart is sill pretty basic and some extra work is needed to configure the axis unit of measure as well as the title.
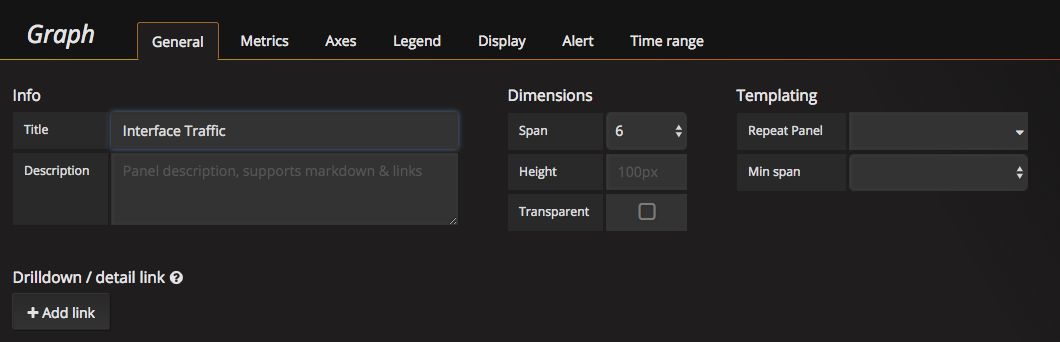
To change the chart title select tab ‘General’ and input the title:
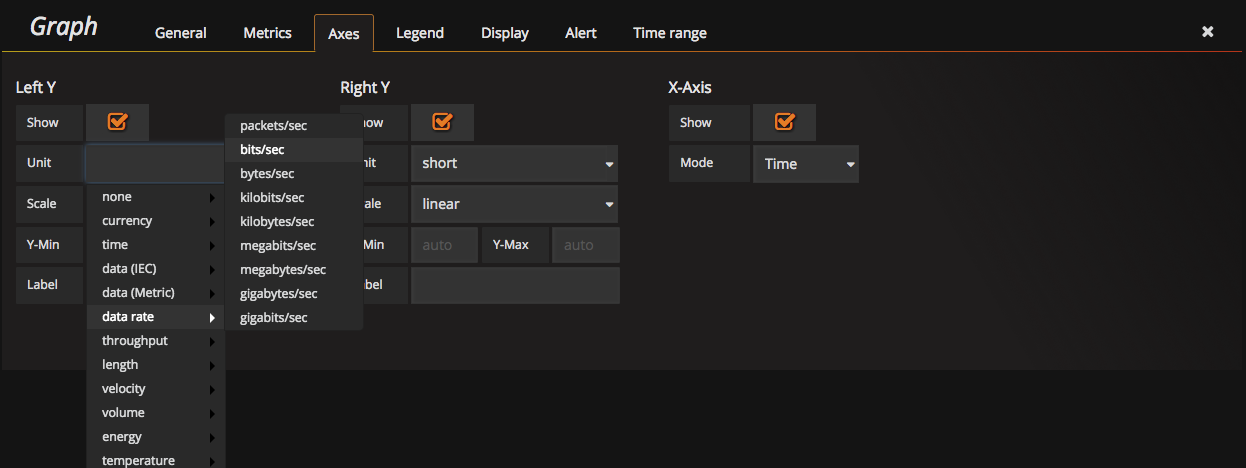
More important, to set the unit of measure of the y-axis select tab ‘Axes’ and pick ‘bits/sec‘ from the ‘Unit’ dropdown.
The final result is shown in the picture below
Adding an Interface Layer-7 Application Protocols Panel
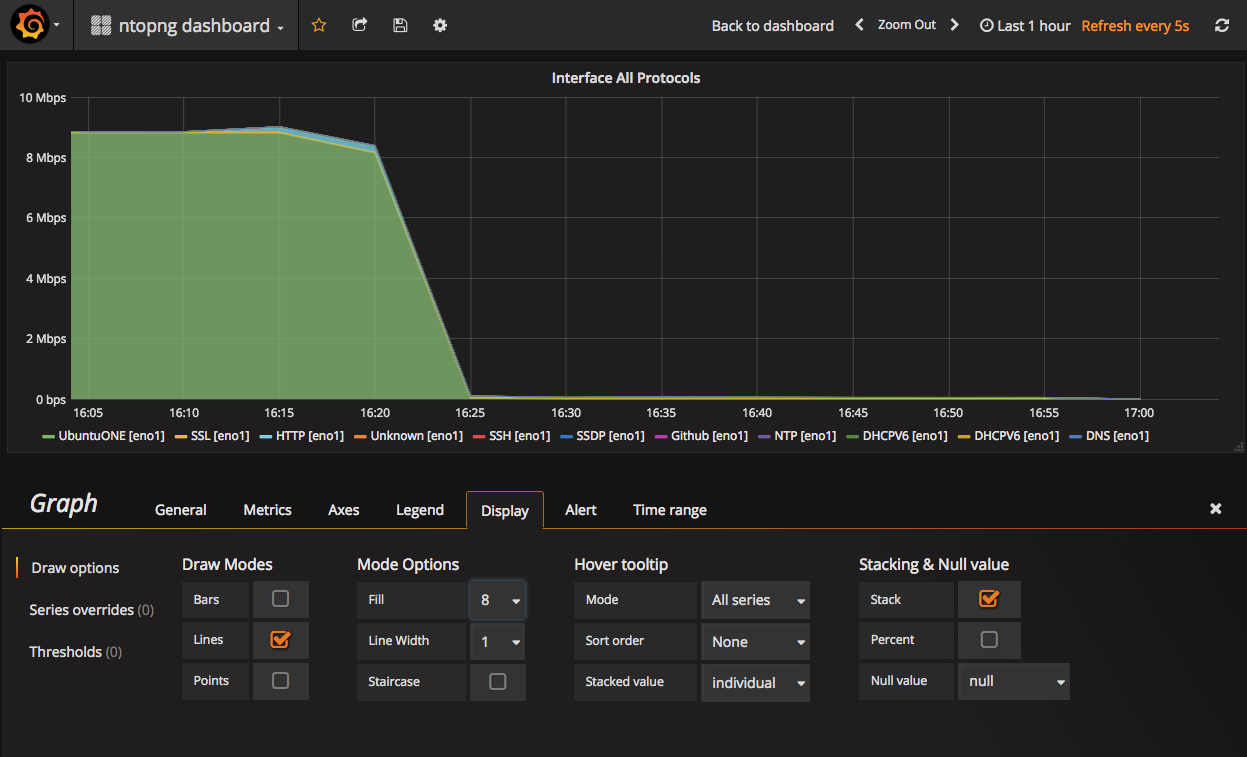
To add an interface application protocols panel the above instructions apply. Just make sure select the interface metric ending in _allprotocols_bps. In addition, as this metric carry more than one timeseries (one per application protocol), it is recommended to stack them by ticking the ‘Stack’ checkbox under the ‘Display’ tab.
The final result will appear similar to the following image
Adding the Interface Average Speed Panel
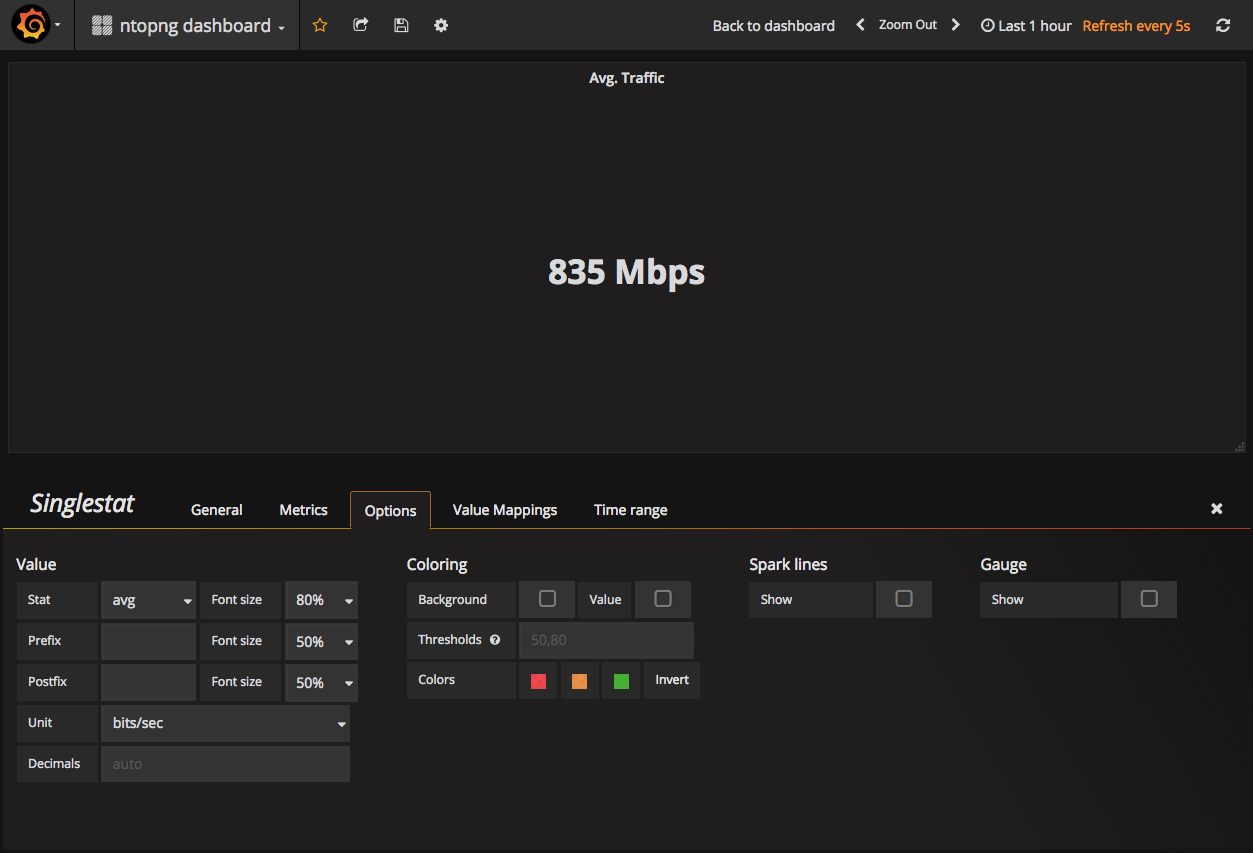
Using a ‘Singlestat’ panel it is possible to crunch a metric using an aggregation function. To visualize the average speed, you can add a ‘Singlestat’ panel, select the interface traffic timeseries, and configure avg as ‘Stat’ in the ‘Options’ tab, as well as bits/sec in the ‘Unit’.
A Full ntopng Grafana Dashboard
By putting together all the panels introduced above, you can build a complete dashboard as the one shown here
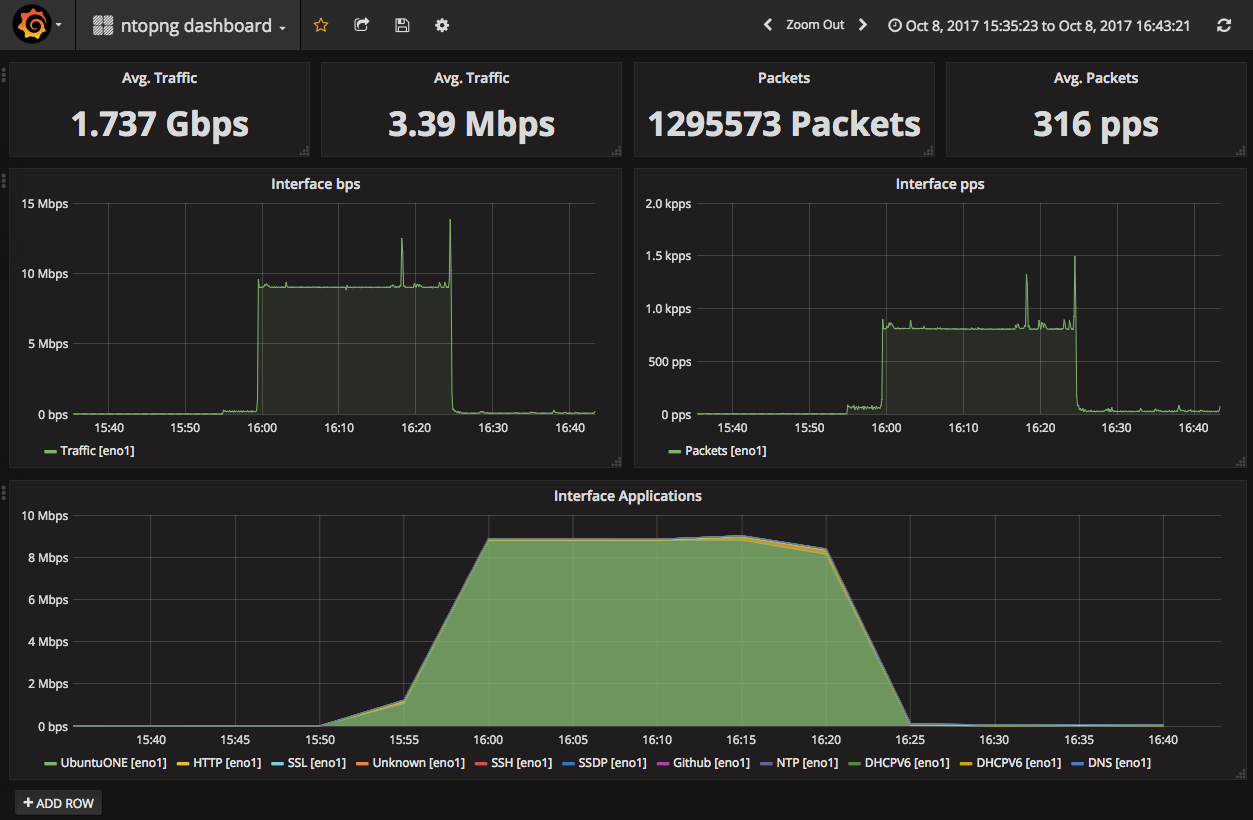
Remember that you can combine panels created with ntopng with panes created from other datasources (e.g., MySQL or InfluxDb). There is no limit on how you can combine panels to create dashboards!
Conclusion
ntopng features an handy datasource plugin that exposes monitored metrics to Grafana. Visualizing ntopng metrics in Grafana will allow you to show ntopng data inside the beautiful Grafana UI, and will give you enough flexibility to mix and match ntopng data with other data sources.