
Threshold alerts and statistical alerts are two different methods for monitoring and detecting unusual or potentially problematic events in various systems, such as network monitoring where anomaly detection is essential. They differ in how they define and identify anomalies:
- Threshold Alerts
- Threshold alerts are based on fixed, predefined values or thresholds.
- You set specific thresholds for one or more parameters or metrics within your system. When these parameters cross the predefined thresholds, an alert is triggered.
- These thresholds are typically static and do not change automatically. You need to set and adjust them manually based on your system’s characteristics and expected behavior.
- Threshold alerts are straightforward and easy to configure, making them suitable for situations where you have a clear understanding of what constitutes normal and abnormal behavior.
- Common examples of threshold alerts include temperature sensors triggering an alert when a room becomes too hot or monitoring network traffic for bandwidth usage exceeding a specified limit.
- Statistical Alerts
- Statistical alerts, on the other hand, rely on statistical analysis and machine learning techniques to detect anomalies.
- Instead of relying on fixed thresholds, statistical alerts use historical data to model what is considered “normal” behavior. They then identify deviations from this model as anomalies.
- Statistical methods can be adaptive, meaning the system continuously learns and updates its understanding of normal behavior based on incoming data.
- These alerts are more suitable for situations where the expected normal behavior may change over time or where it’s challenging to define specific thresholds.
- Statistical alerting techniques include methods like Z-score analysis, Mahalanobis distance, or machine learning algorithms such as clustering, time series analysis, or deep learning.
The choice between threshold alerts and statistical alerts depends on the specific requirements of the monitoring system and the nature of the data being analysed. In some cases, a combination of both approaches may be used, with threshold alerts acting as a first line of defense for obvious issues and statistical alerts providing a more advanced and adaptable layer of anomaly detection for subtle or evolving problems.
In ntop we have implemented both methods in order to accommodate all user needs. You can trigger these alerts by setting a threshold on a single metric and let ntopng emit an alert when the threshold is crossed.
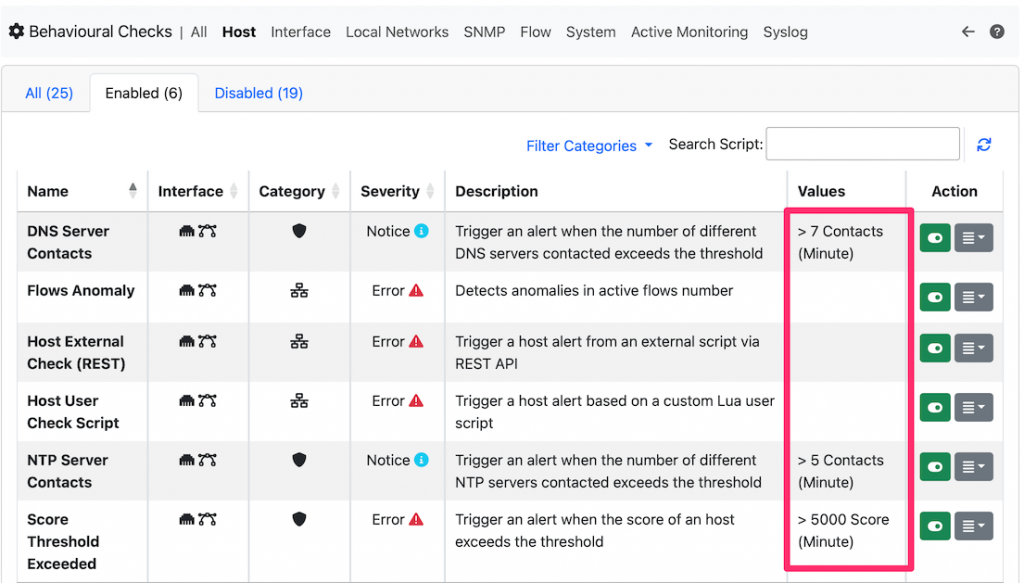
Behavioural checks contain several threshold based alerts: you set a threshold based on an arbitrary value you specify and that you think it’s reasonable for a given use case. For instance a usually contacts at most two DNS servers (primary and secondary) so setting a conservatory threshold to 7 will allow you to spot hosts that are misbehaving or DNS servers (in this case you need to set a Behavioural Exception to avoid triggering invalid alerts).
If you go under (ntopng left sidebar) menu Hosts -> Local Traffic Rules you can set more sophisticated alerts based on both an absolute threshold or with respect to the recent past.
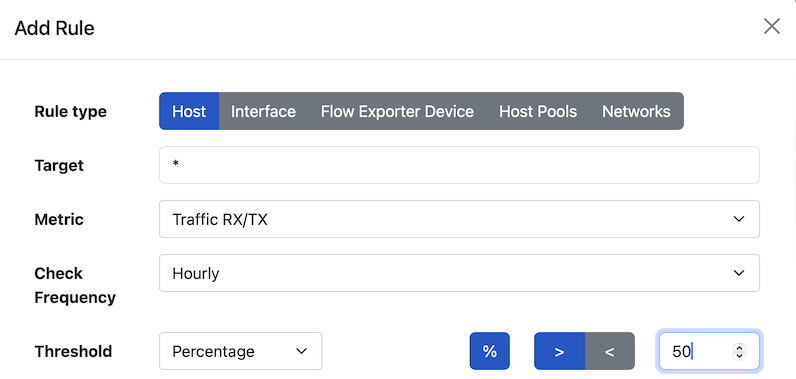
In the above example you see a rule that for each local host, triggers and alert if the host traffic exceeds of 50% the traffic of the previous hour (you can set different frequencies such as 5 minutes or day). This rule can be defined for a specific host, or for all hosts. By selecting the rule type, you can specify similar rules to trigger other problems, such as a flow exporter (e.g. a NetFlow/sFlow device) that stops sending flows, or a network interface whose traffic is too much/little with respect to its recent past.
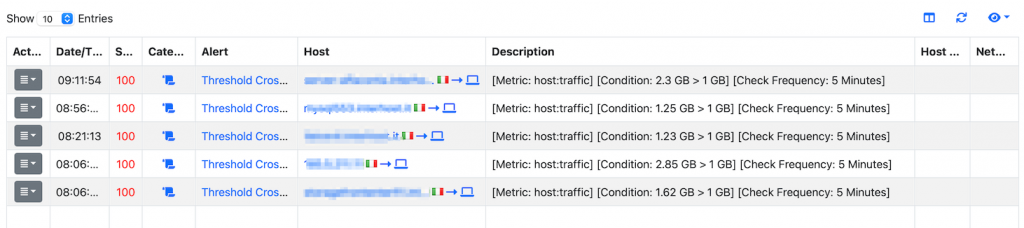
In case a threshold is crossed an alert is reported as shown in the above picture.
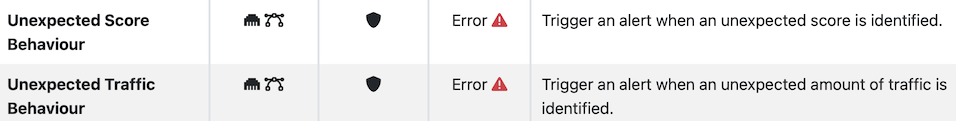
In addition to the above alerts, ntopng implements more sophisticated alerts based on statistical analysis that allow to detect changes in behaviour rather that using (semi-)static thresholds.
In the above cases, ntopng continuously computes a range of lower/upper values that are considered normal for a given metric. These values are used to predict the range of the next metric that in case it is too low or too high, it triggers an alert.
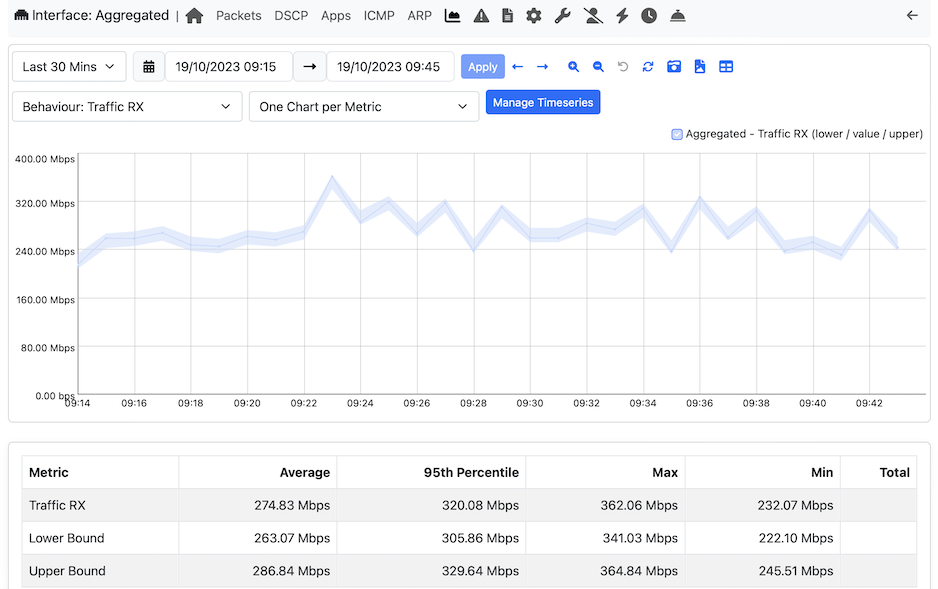
Above you can see an example of behavioural timeseries analysis. Note that threshold are continuously computed with no human operator interaction necessary.
Final Remarks
In summary some of the statistical traffic analysis features of ntopng include:
- Traffic Flow Analysis: ntopng can display detailed information about network flows, showing source and destination IP addresses, ports, protocol types, and the amount of data transferred. This information allows you to analyze traffic patterns statistically.
- Historical Data: ntopng can store historical network traffic data and provide you with the ability to view and analyze this data over time. This feature allows you to identify trends, peak usage periods, and changes in network behavior.
- Protocol Analysis: It provides detailed statistics on the usage of various network protocols, such as HTTP, DNS, FTP, and more. You can view which protocols are most heavily used and identify anomalies or unusual traffic patterns.
- Application Visibility: ntopng can classify traffic by application, helping you understand which applications are consuming network resources. This is valuable for monitoring and optimizing network performance.
- Anomaly Detection: While ntopng doesn’t provide advanced machine learning-based anomaly detection, it can help identify traffic patterns that deviate from the norm. Unusual spikes or deviations in network traffic can be indicative of potential issues.
- Alerting: ntopng can generate alerts based on various criteria, including traffic thresholds. .
- Traffic Reports: It can generate reports that include various traffic statistics, top talkers, top applications, and more, helping you analyze network traffic statistically.
Enjoy !