Hello everybody!
Welcome back to the weekly blog post of this serie used to update you with the latest ntopng features and graphical changes. Please let us know your feedback!
Today we are going to talk about Host Traffic Analysis.
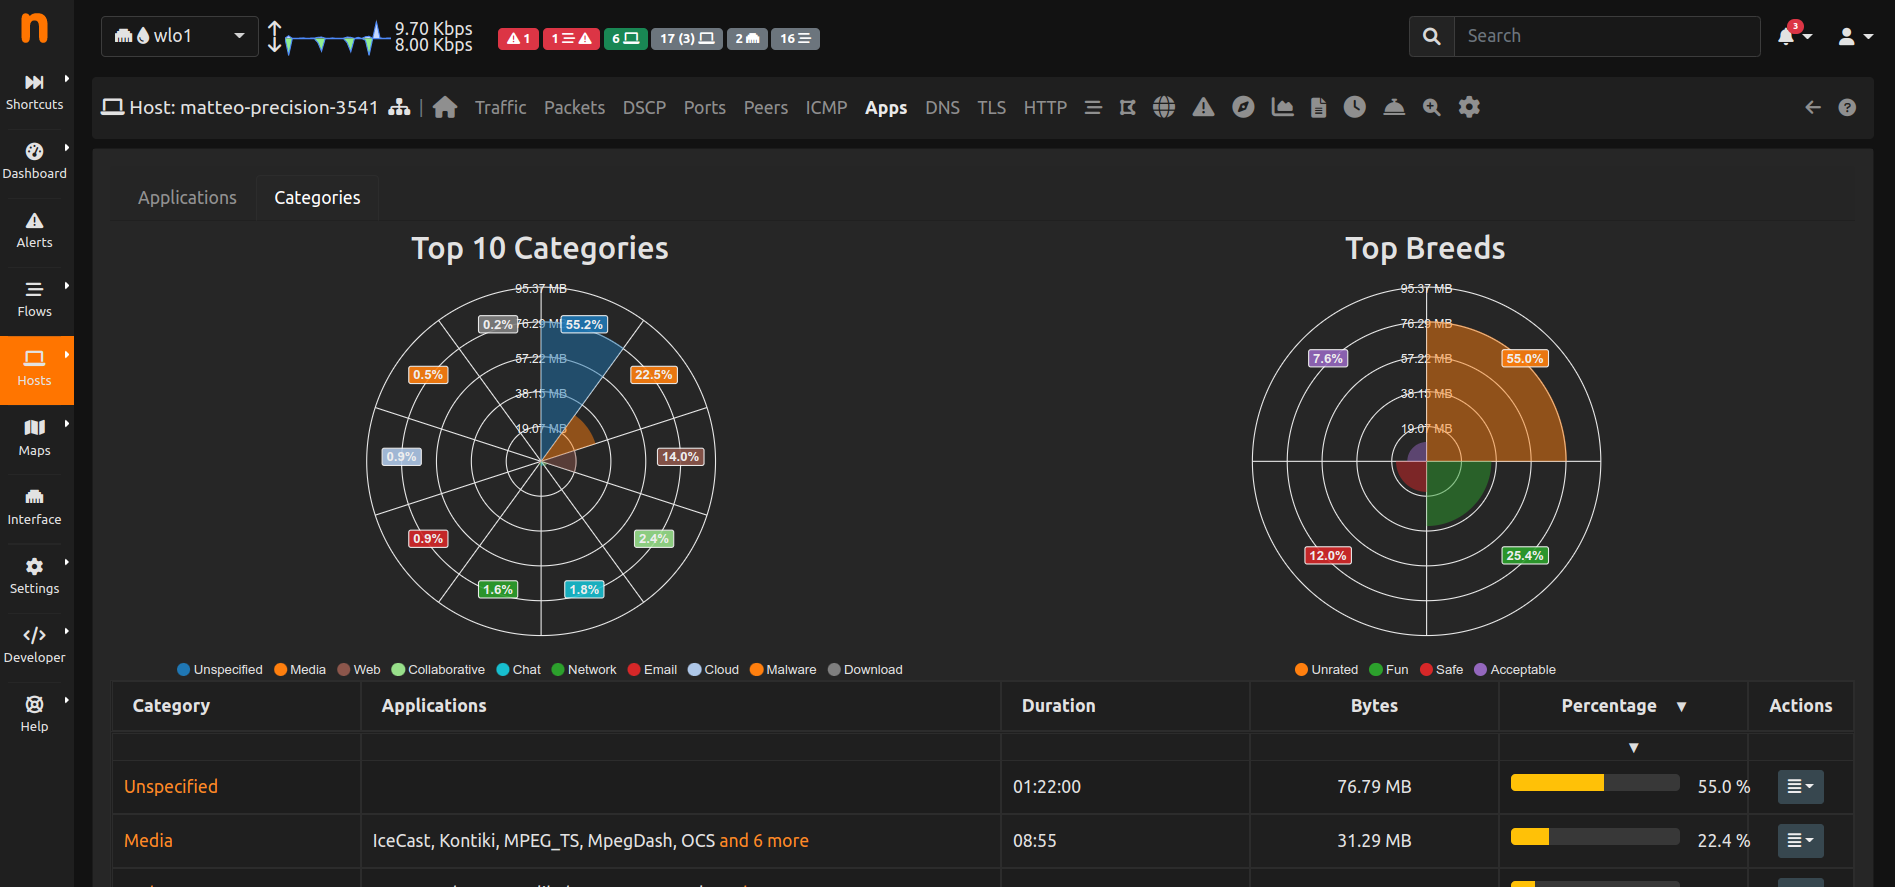
When analyzing traffic generated by a host, one of the main metrics we are interested in protocol traffic. ntopng keeps many traffic counters for traffic a host generates/receives, including traffic per protocol (e.g. TCP), application protocol (e.g TLS), breed (e.g. Unsafe Traffic), etc. In order to enhance those information, we have decided to rework the old Traffic and Application details pages and redesign it
First of all it is important to give both a detailed and a generic view. For this reason we put both charts, displaying the generic view, and tables, displaying the details.
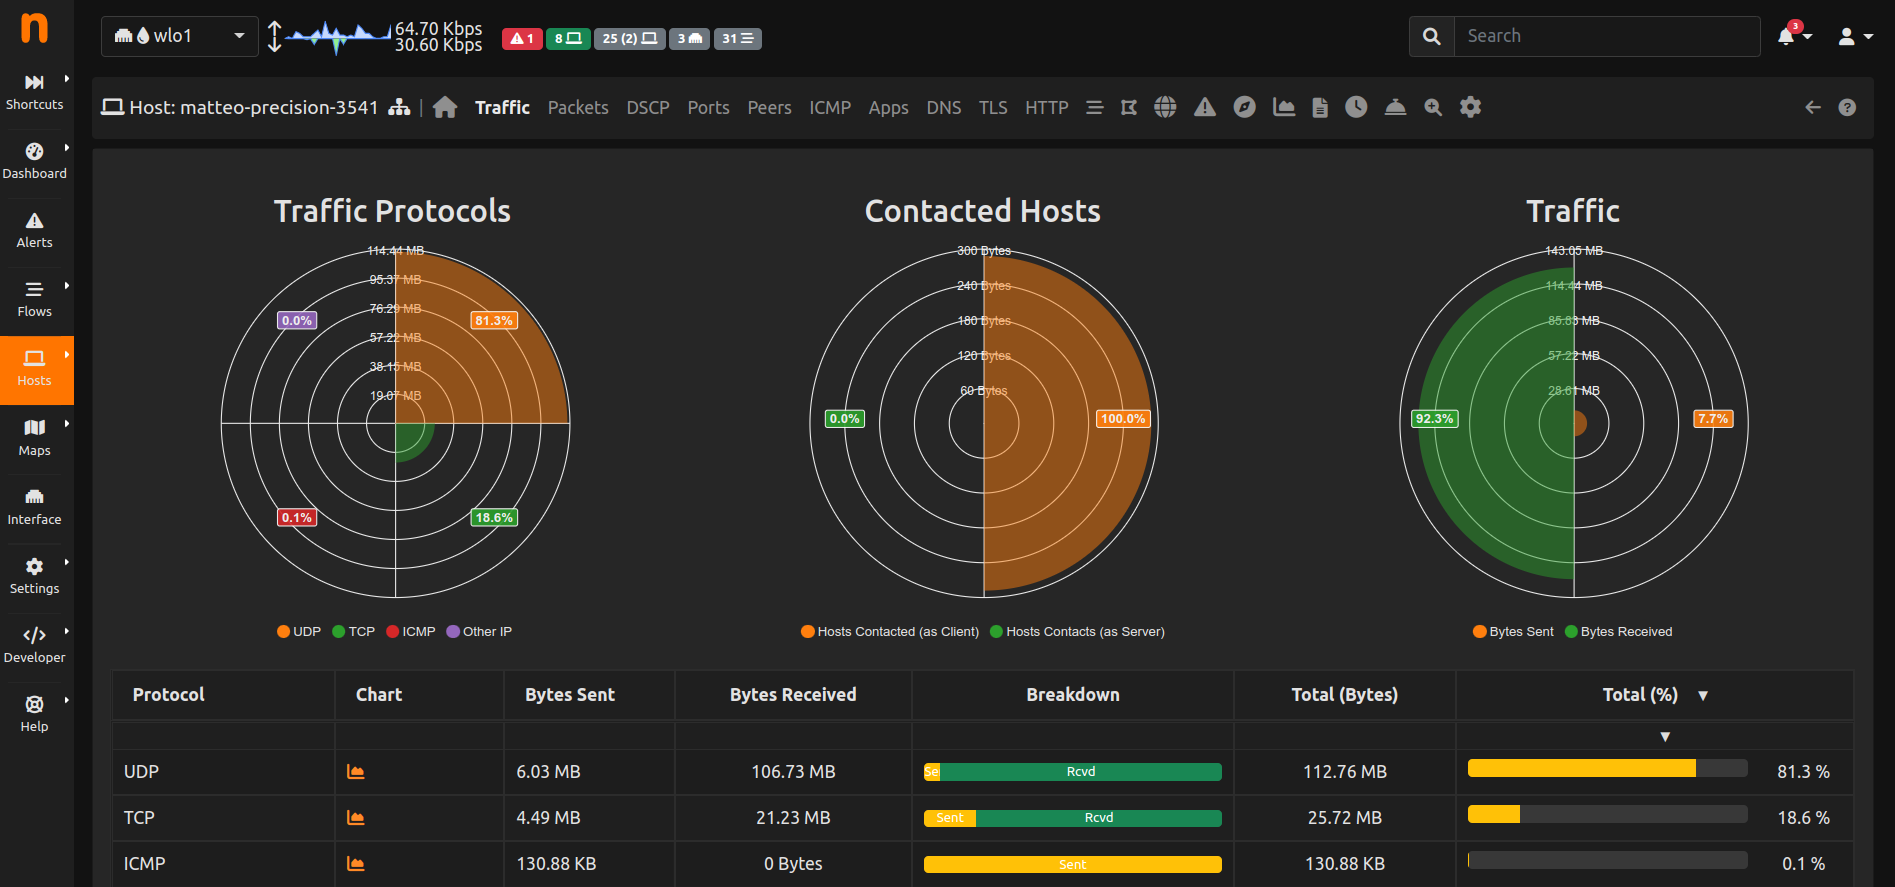
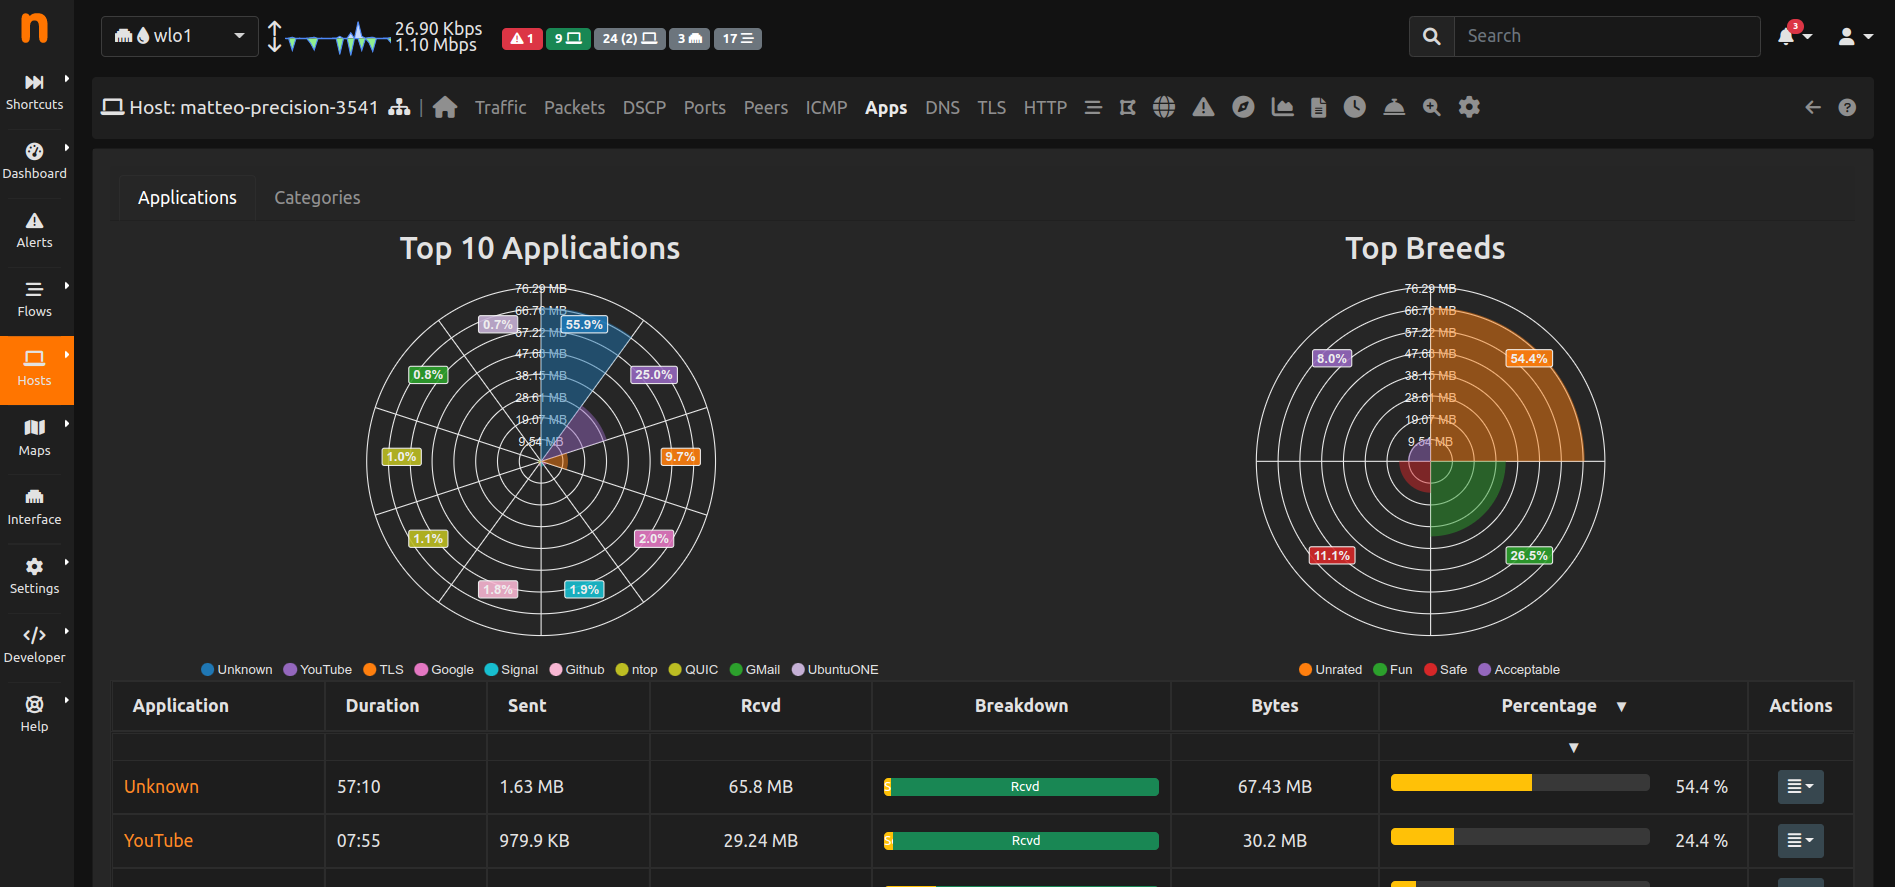
Both pages contain the same type of information:
- Traffic (Sent, Received and Total)
- Breakdown (comparison between the percentage of Traffic Sent and Received)
- Hyperlink to Historical Data (to ClickHouse if configured and to Historical Charts if enabled)
Furthermore, in the Application page, it is possible to switch between Applications and Categories (e.g. P2P or SocialNetworks), in order to analyse even Categories information (Categories are closely related to Applications).
Enjoy!