Last year we have announced the integration of ClickHouse, an open source high-speed database, with nProbe for high-speed flow collection and storage. Years before we have created nIndex, a columnar data indexing system that we have integrated in ntopng, but that was just an index and not a “real” database. We have selected ClickHouse for a few reasons:
- It is open source and developed by a vibrant community.
- It is very efficient in both speed and size, that were the main features for which we created nIndex. This is very important as it allows to store on a single host with a single SSD several billion records and have sub second queries contrary to similar solutions that instead requires a multi-node host cluster that increases costs and complexity.
- It is MySQL compatible, meaning that those who have used ntopng with MySQL can be familiar in no time with this new solution without having to learn something new (just remember that ClickHouse listens on port 9004 instead of MySQL’s 3389 port).
Today we announce the integration of ClickHouse in ntopng that replaces the previous MySQL and nIndex integrations (you can migrate existing data using a utility we have created). Currently it is available in ntopng dev (with Enterprise M license or better, same as nIndex) and it will be available in about two weeks in the upcoming 5.2 ntopng stable release when we’ll .
Instaling and Enabling ClickHouse in ntopng
In order to enable ClickHouse you need to
- Update to the latest ntopng dev version.
- Install ClickHouse using a binary package as described here. Please note that the clickhouse-client tool must be installed on the host where ntopng is running, whereas you can store data either on the same box where ntopng runs or on a remote host. Most people can put everything on the same host, but for large installations a separate ClickHouse host (or cluster) can be a better option.
- Modify your ntopng.conf file and add “-F=clickhouse” in order to enable ntopng to send data to the clickhouse instance installed on the same box using the default user (named default) and (empty) password. For a more comprehensive solution the -F option supports several additional options whose format is “-F clickhouse;<host[@port]|socket>;<dbname>;<user>;<pw>”.
Note that when you use clickhouse, the database will be used for both flow and alert storage, meaning that alert storage will be much more efficient than the built-in SQLite backend that will still be used in non-ClickHouse setups.
Using ntopng with ClickHouse
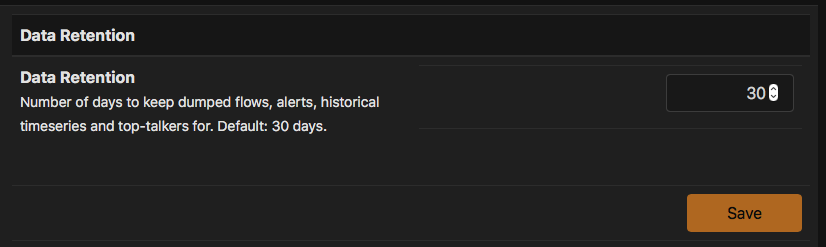
As previously said, ClickHouse is in essence an nIndex replacement that brings many new features that only a database can offer. We have enhanced the existing historical flow explorer that can now benefit from complex query operators that are now finally supported. When you enable ClickHouse alerts and flows will be stored permanently on the database using a configurable retention time from the preferences page.
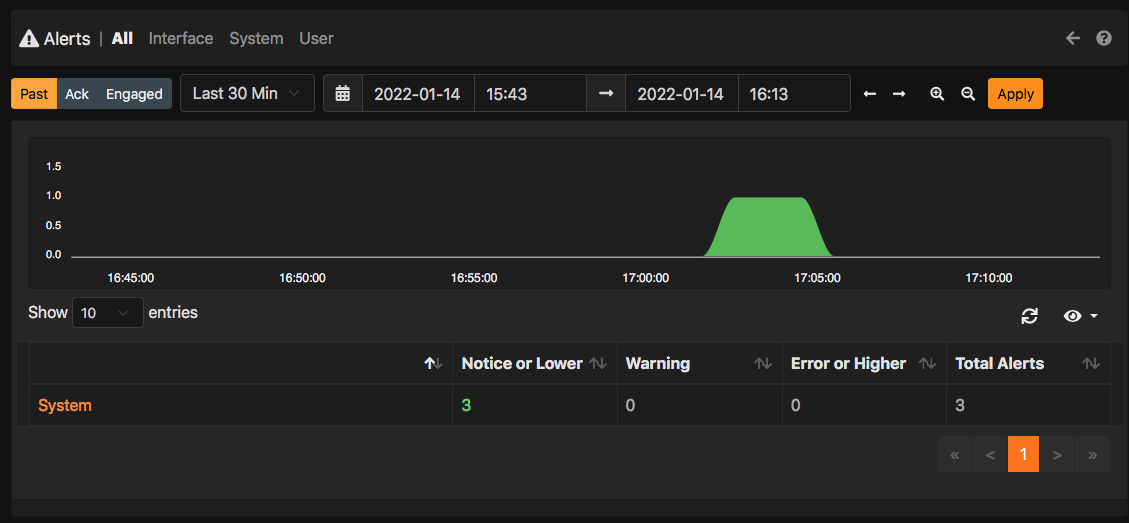
Data is stored periodically on ClickHouse as due to its nature we cannot push data continuously as you would do with a standard database. This means that data is insert in ~1 minute batches so historical data is slightly delayed with respect to realtime. In the alert view you will not see any difference with respect to SQLite beside the cardinality and the overall speed.
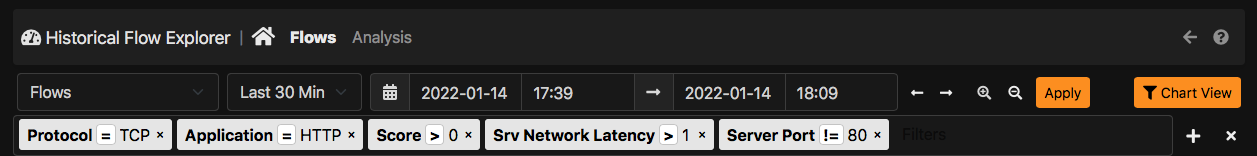
The main difference is instead in the Historical Flow Explorer that can be found under the dashboard menu.
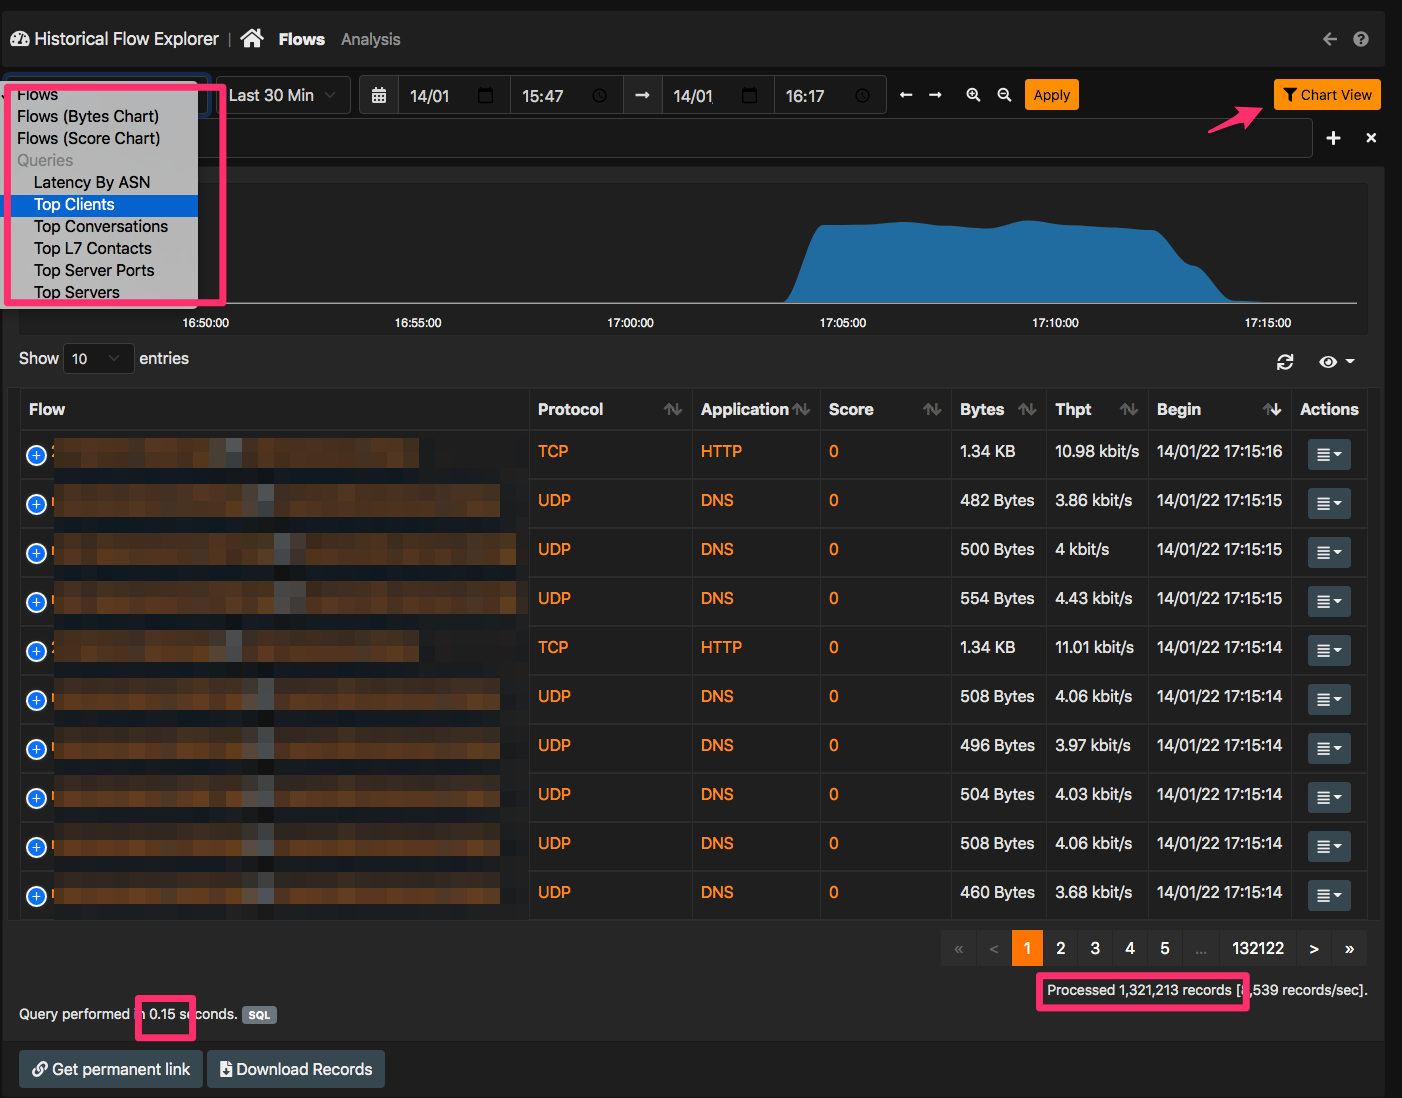
As you can see in the top left menu you can see some queries you can perform on data. They are extensible via simple JSON scripts that you can find here. As you can see it is pretty straightforward to add a new reports: just drop your script in the historical folder and they will appear in your ntopng instance with no programming at all. At the page bottom you can find statistics about query just executed. In the above example 1.3 million records are returned in 0.15 sec on a single host with rotating drives, so you can imagine what you can do with flash storage. In the top right corner you can find a button that, preserving the filters that have been set, allows you to see the same results graphically by jumping into the analytics view that is also extensible via JSON scripts as explained above.
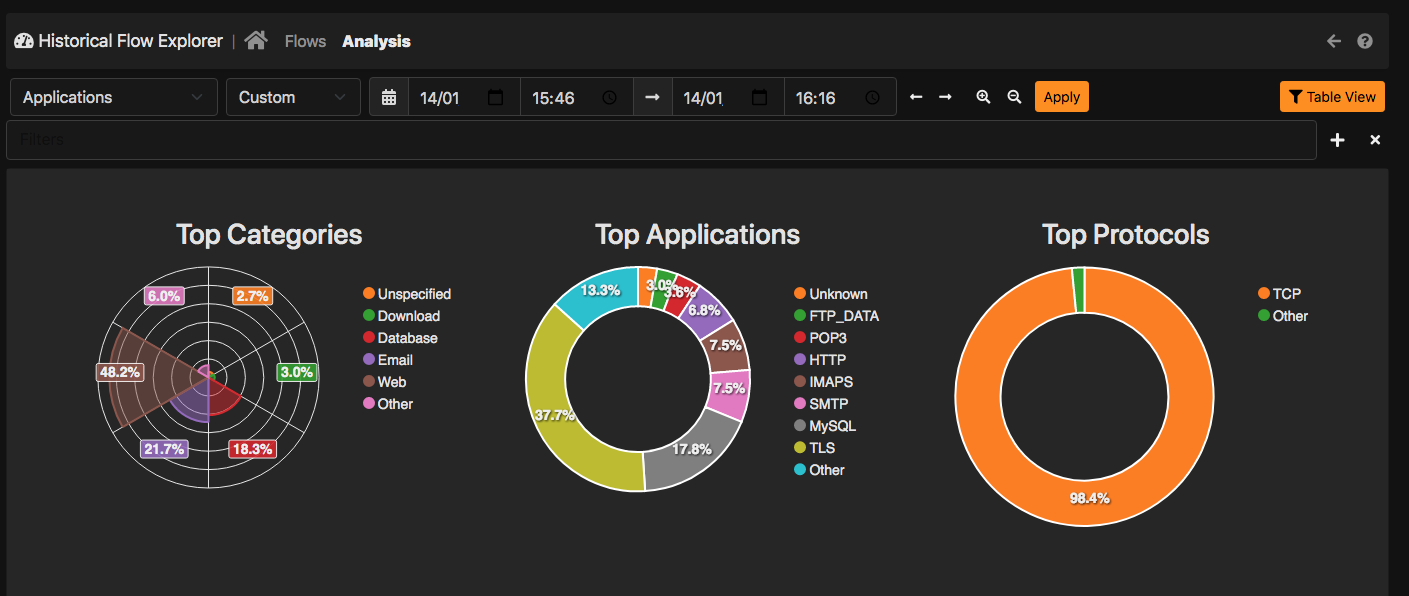
You can set filters for all the available fields including comparison operators or contains for strings.
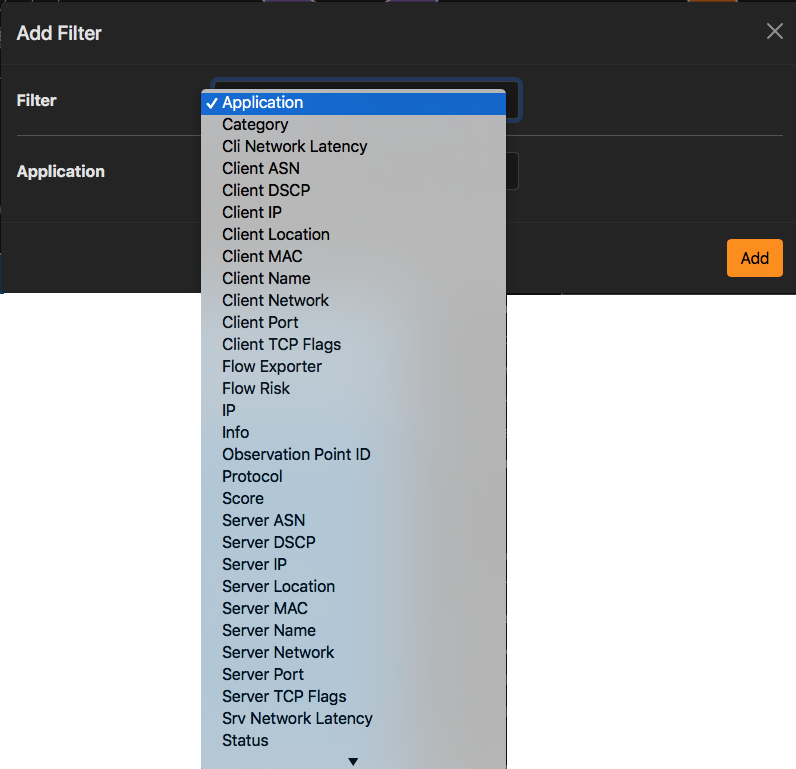
Example of filtering.
Dimensioning Storage
Under the system interface on the Health -> ClickHouse you can find a page that shows you the storage being used. In our tests the average size of a record (flow and alerts are basically the same) is about 30 bytes for flows and 88 bytes for alerts.
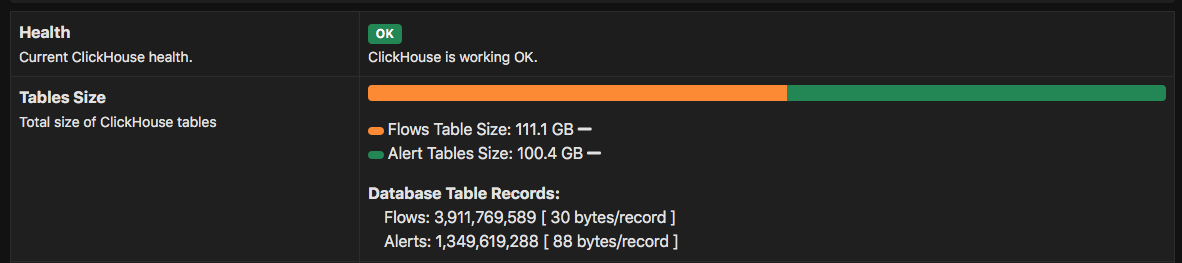
This means that with a SSD 512 GB that costs about 100 Euro/$ you can store 15 billion flows and 15 million alerts and still have free disk space available. Very good isn’t it? Note that we partition records according to the day, so if you have a long retention (e.g. 6 months or 1 year) the search or insert performance is not affected as we partition the data per day. So in essence you will notice a performance degradation only if you run queries that span across several days/weeks otherwise saving 3 days of data or 3 months of data doesn’t change much in performance.
Final Remarks
If you want to read more about ClickHouse support in ntopng please refer to the user’s guide. Other than this we want you to play with this new feature we have implemented and report us errors or improvements you expect us to accommodate before the next stable release.
Enjoy !