It has been a while since we have added SNMP support to ntopng. The first release, presented in this blog post, implemented basic SNMP support. Since then we have code various improvements and new feature, with the aim of turning ntopng in an advanced SNMP monitor.
Among the extensions we have implemented are the following:
- A cache to decouple the polling of devices from the browsing of polled data
- Devices are polled periodically by ntopng with a background task that cycles them at 5-minute intervals and sends polled data to the cache
- Polled data is fetched from the cache when users browse ntopng SNMP web pages, yielding almost-instantaneous response times
- Ability to add multiple devices with a single action
- ntopng can scan and automatically add all the SNMP devices of a /24 network
- 64-bit SNMP v2c+ counters
- Extended monitoring of SNMP devices
- Details page
- Stacked charts of top interfaces
- Seen Mac addresses
- Extended monitoring of SNMP device interfaces
- Throughput
- Last-change
- Input and output bytes
- Seen Mac addresses
- Ability to alert when the status of an SNMP device interface changes
- Useful to detect a flapping interfaces or interfaces connections/disconnections
These most important improvements are discussed below.
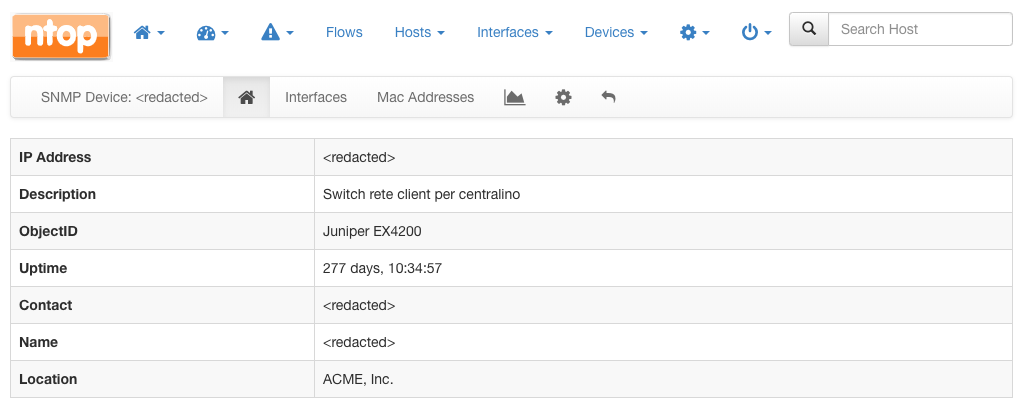
Extended Monitoring of SNMP Devices
SNMP devices have now their detailed page with a handy menu to browse their interfaces, seen mac addresses and historical charts.
The most useful historical chart is probably the stacked one that shows the top interfaces traffic speed over a certain timeframe. Right below the chart, interfaces total for the same timeframe are shown as well.
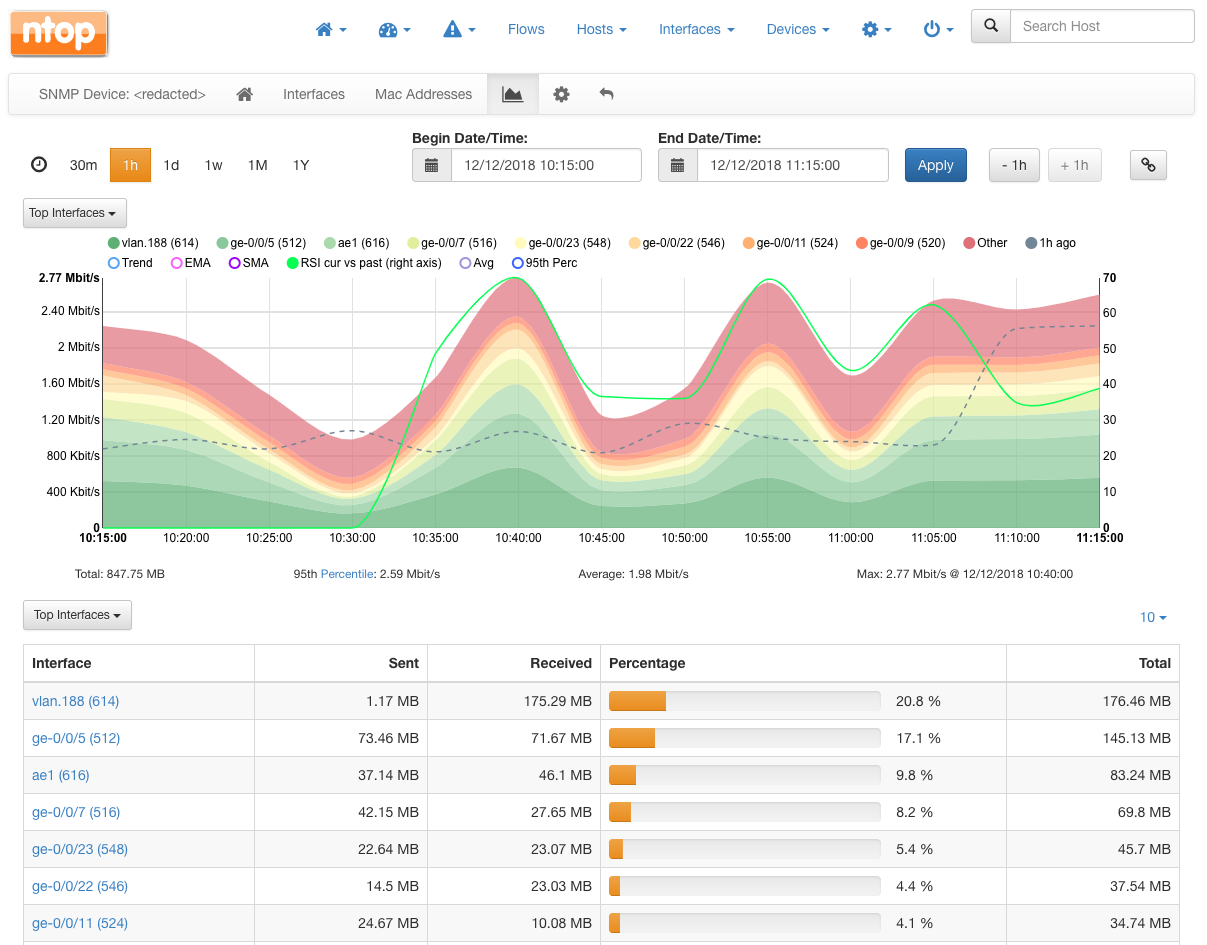
Hyperlink on the interfaces can be clicked to access the details page of any of the monitored interfaces.
Extended Monitoring of Device Interfaces
Devices interfaces are now show in a dynamically-loaded, paginated table. Data show is fetched from a cache which is populated by ntopng in background. This means you will not have to wait for potentially long SNMP walks before seeing the results – ntopng will do periodic walks in background to keep the cache updated!
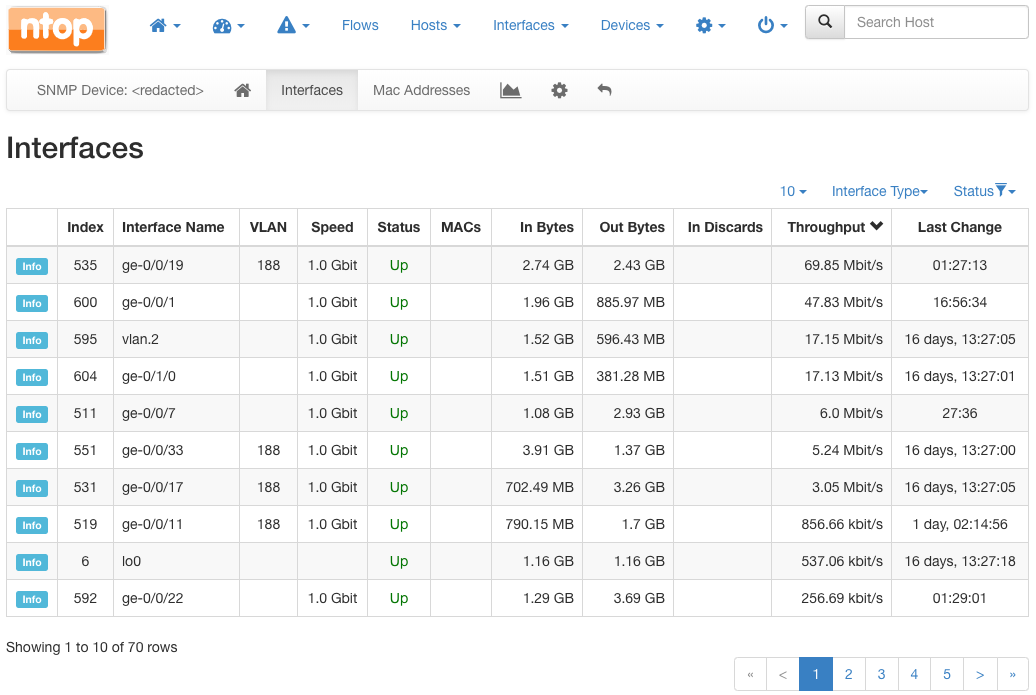
Among the newly added columns, “Throughput” is probably the most important as it provides an immediate way to see the current load of any interface. Wondering how is this throughput calculated? Well, ntopng makes the difference between the total traffic polled during the two most recent SNMP walks, and divide it by the time that separates these two polls. And if you are wondering when the most recent SNMP walks have been performed, you can check the bottom of the page to see the exact dates and times.
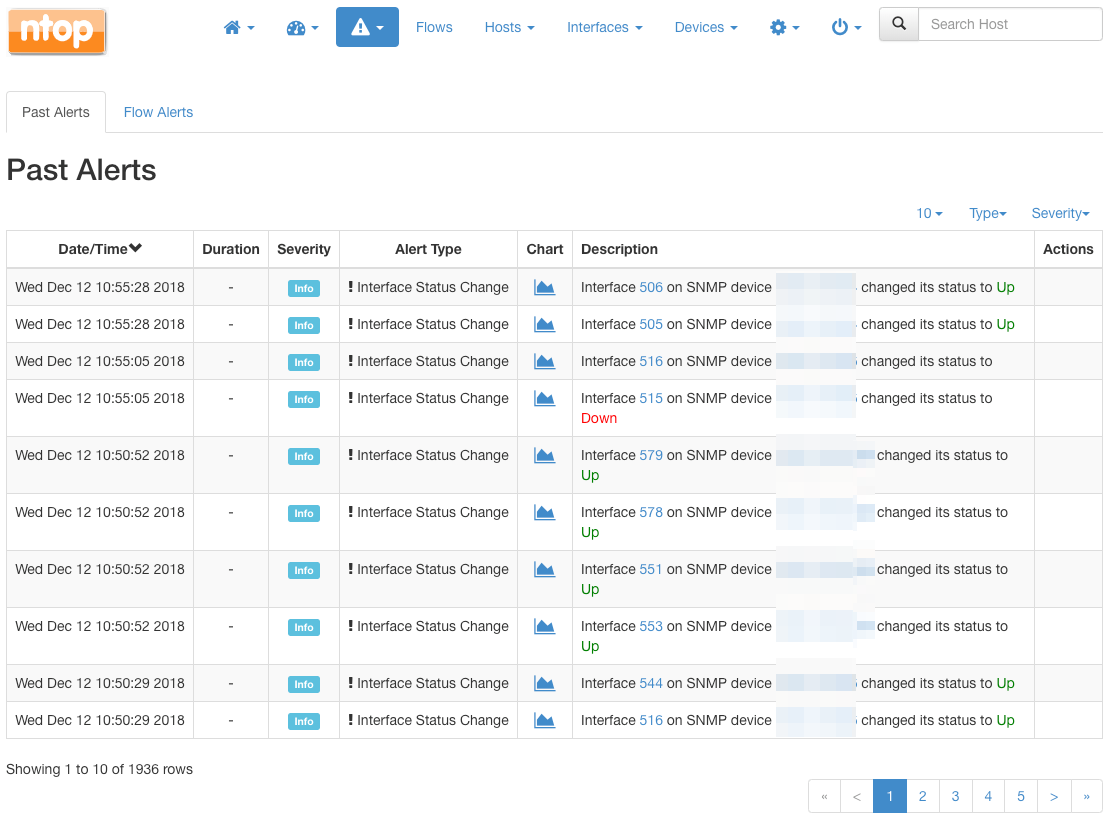
Alerts on Interfaces Status Change
Interfaces status changes could unveil potentially critical issues, including:
- A faulty interface that flaps, periodically going from up to down and vice versa
- Someone has connected or disconnected to an interface
ntopng has now the ability to signal such events using alerts. Alerts are reported inside ntopng but can also be exported to third-party endpoints such as email, Syslog, Slack and Nagios.
Happy SNMP monitoring with ntopng!