Almost 3 years ago we introduced Active Monitoring support in ntopng. This allows you to monitor the infrastructure and make sure that all systems are operational. In fact ntopng can continuously monitor hosts in your network by periodically running different active measurements including:
- ICMP, which measures the RTT (Round Trip Time).
- Continuous ICMP, which evaluates network reachability and service availability.
- Speedtest, which estimates the Internet bandwidth and latency contacting a speedtest server.
- HTTP(S), which checks the HTTP/HTTPS availability of web servers.
- Throughout, which tests the throughput contacting an HTTP server.
As a result, it is possible to:
- Monitor the status of the services over time, by looking at the table in the Active Monitoring page which contains all the measurements.
- Get notified when a measure is failing or the result is not satisfying a threshold, by triggering an alert.
- React (Automatically) with some custom action, for instance running a script, when a service goes down, to restore it.
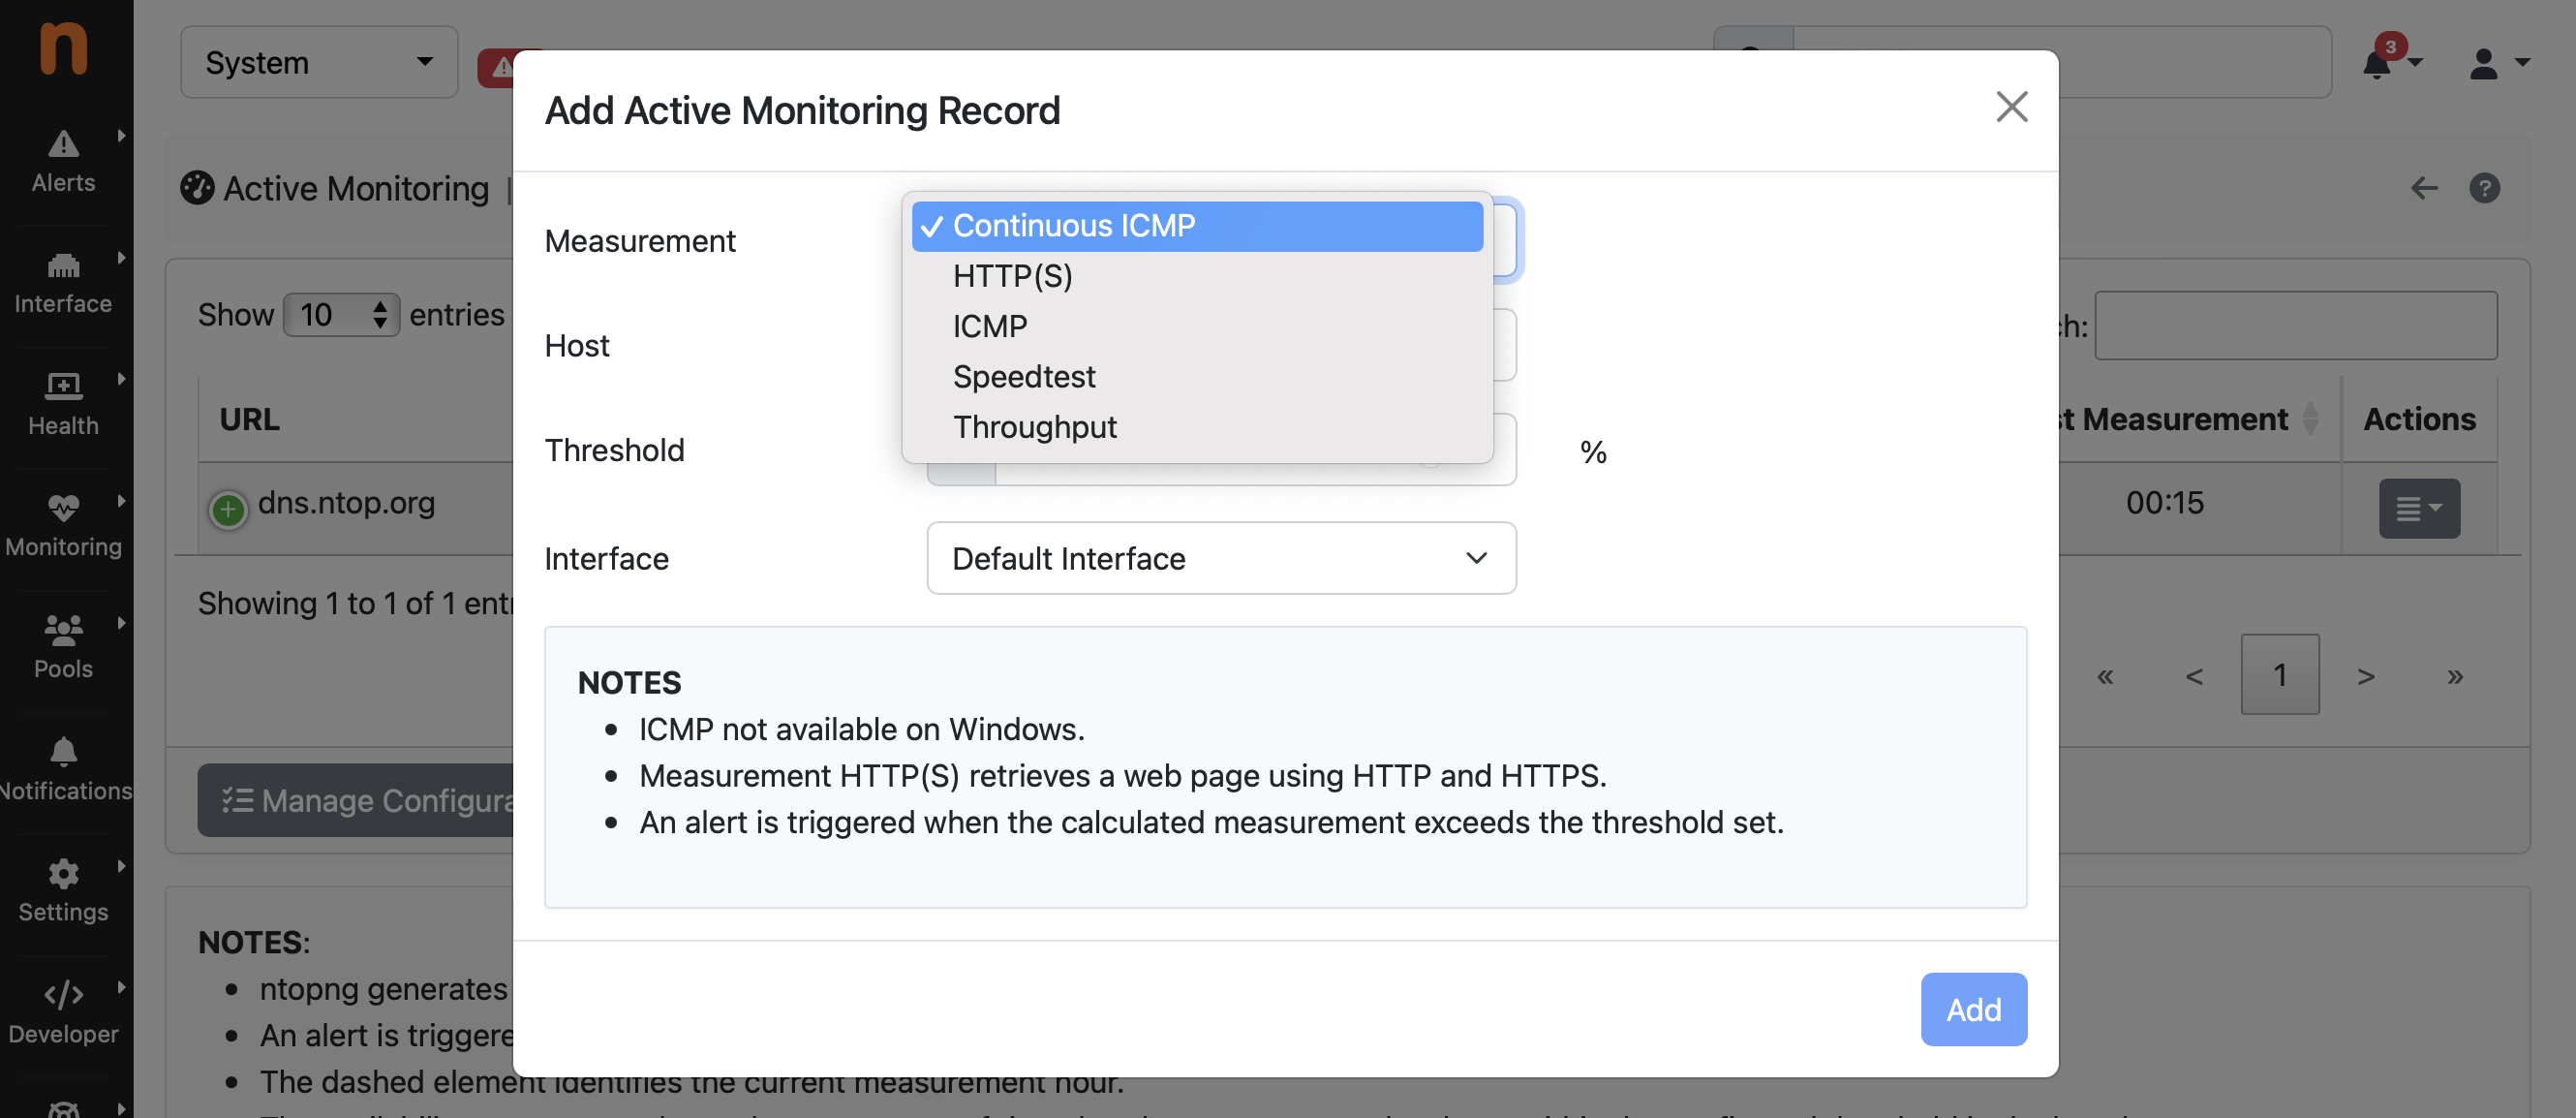
Add a new Measurement
As we have seen in a few previous posts, adding a new service to be monitored is easy:
- Select the System interface from the drop down at the top of each page.
- Go to the Monitoring -> Active Monitoring page from the sidebar
- Click on the add button (+)
- Select the measurement, the host/service to check and a reasonable threshold that should not be exceeded if the service is operational
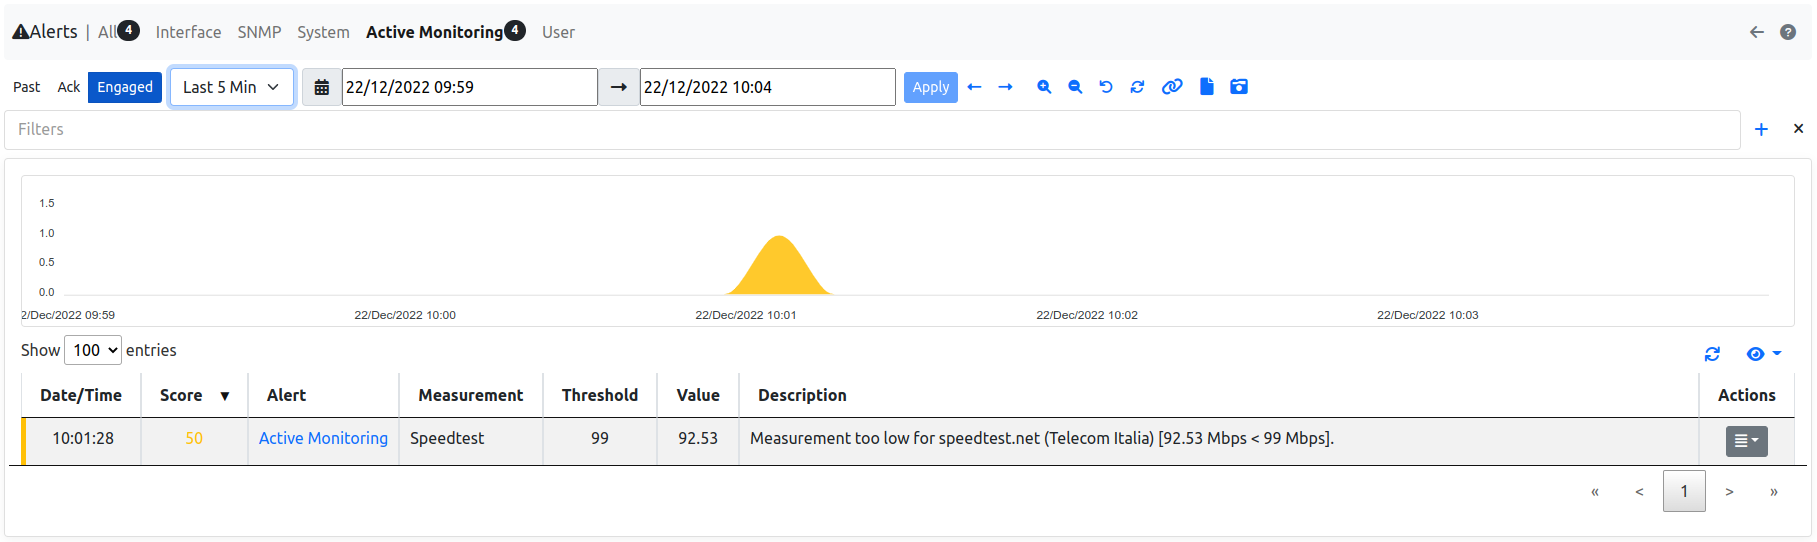
At this point ntopng will periodically check the measure, and trigger an alert in case of failure. Those alerts are visible under the Alerts -> Explorer -> Active Monitoring page.
Get Notified
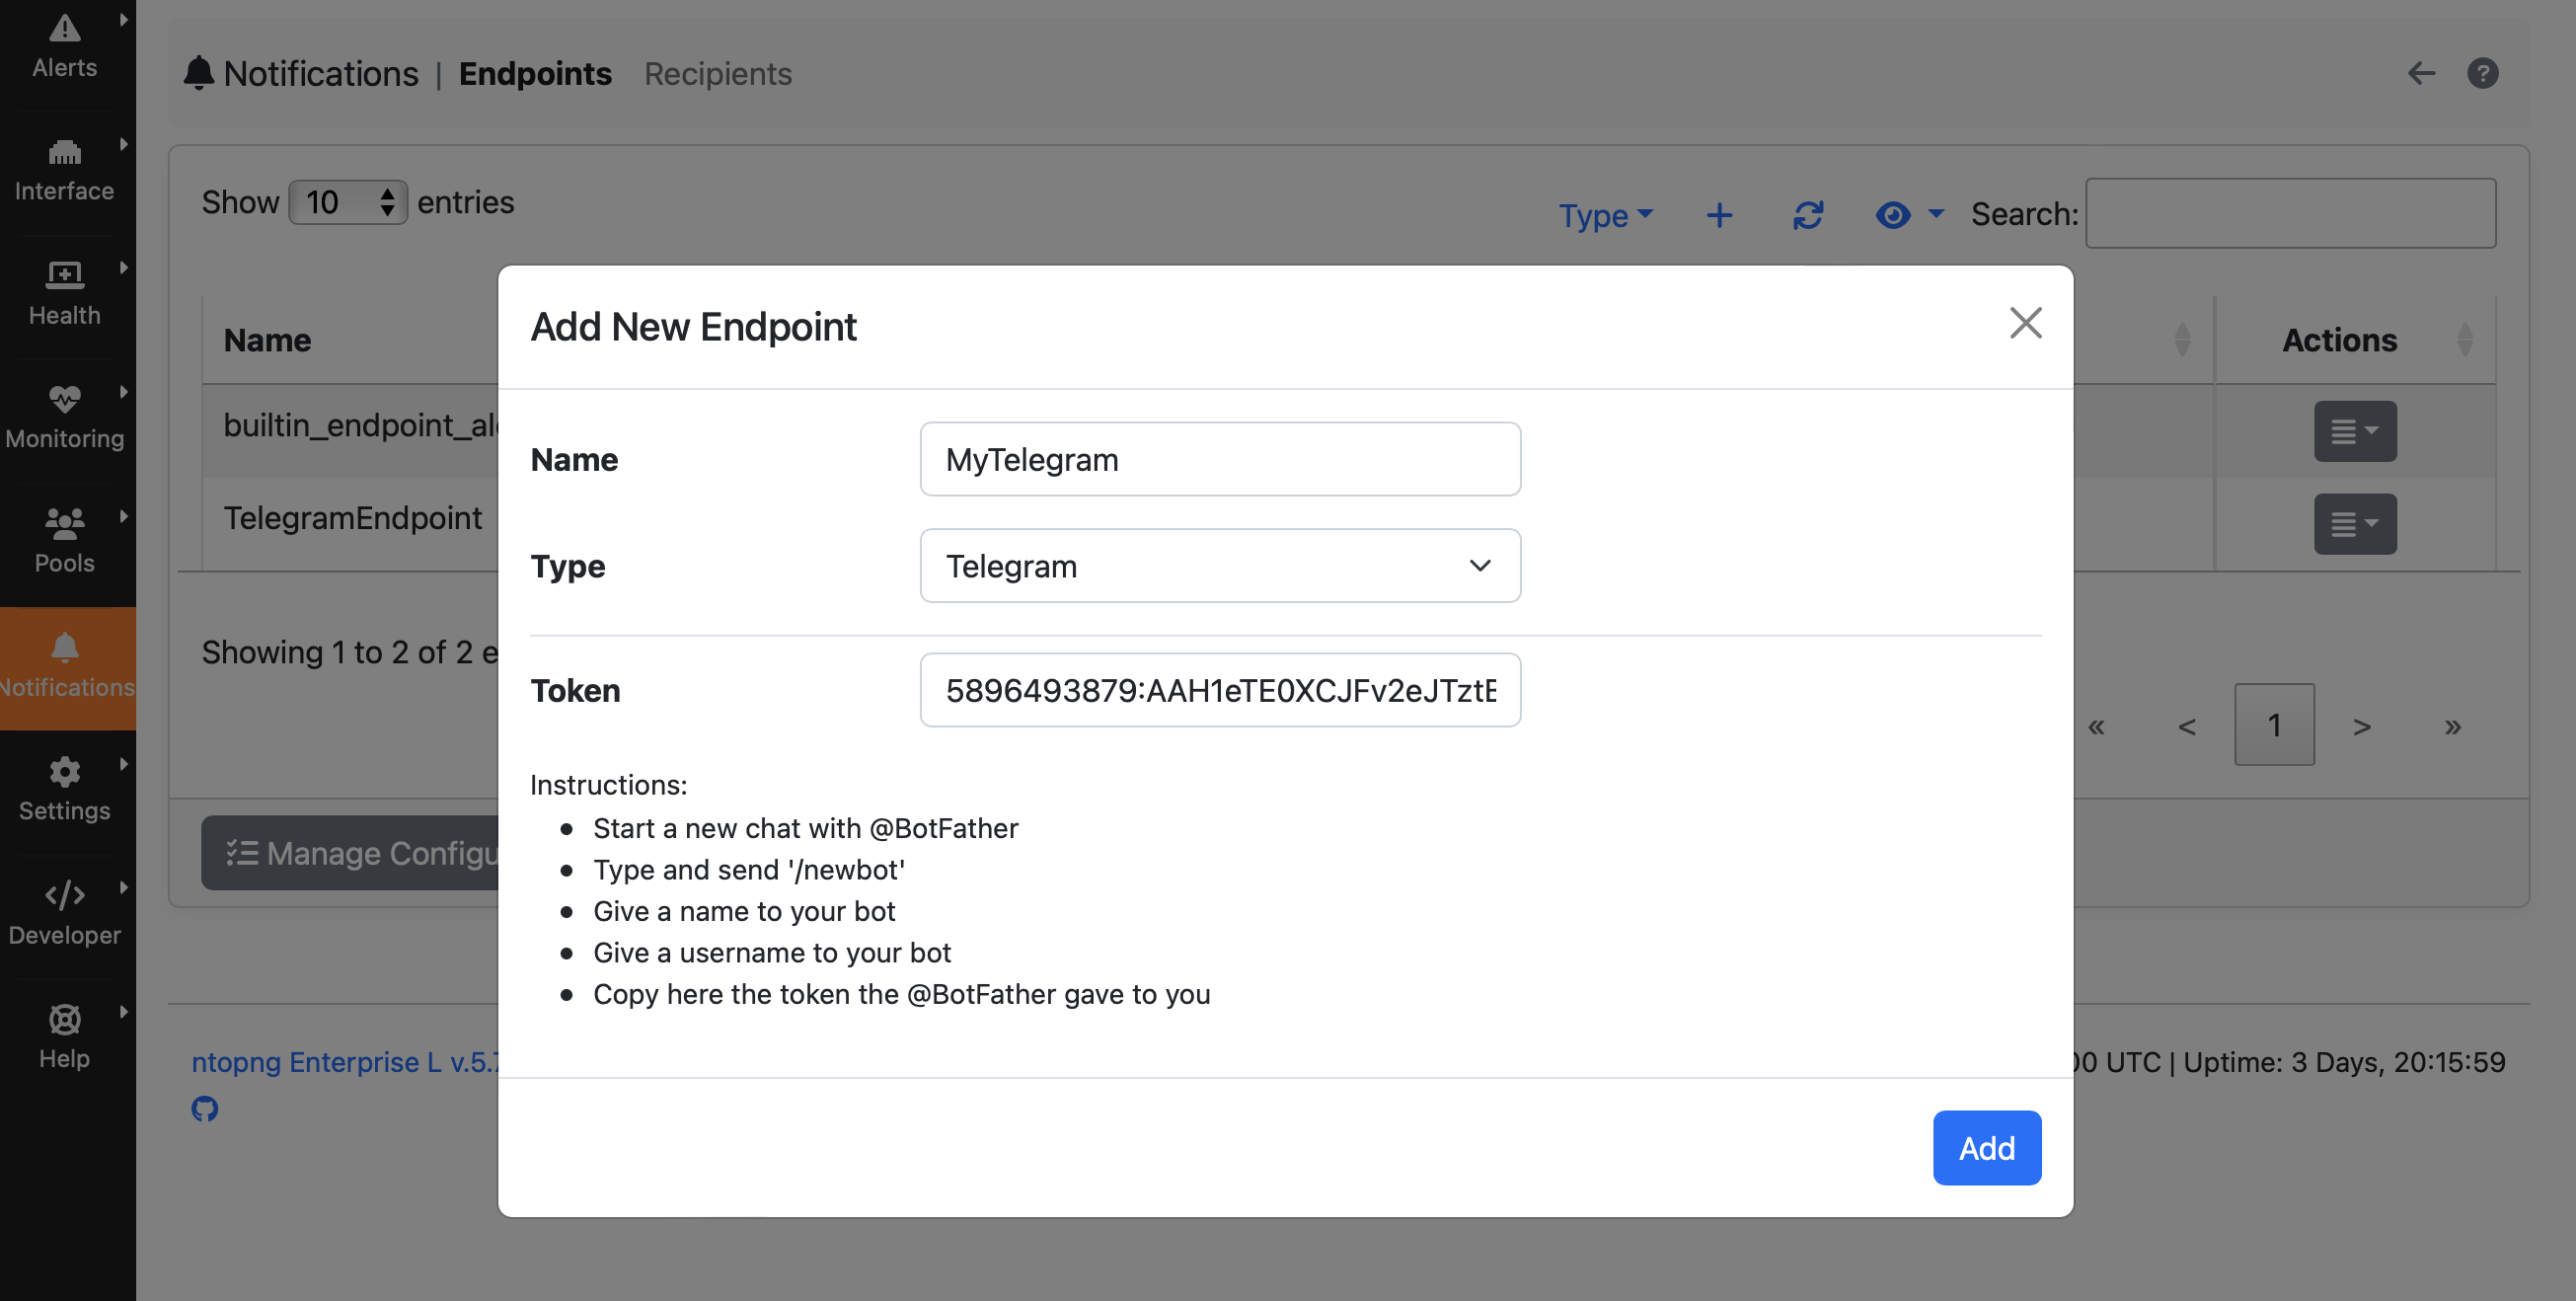
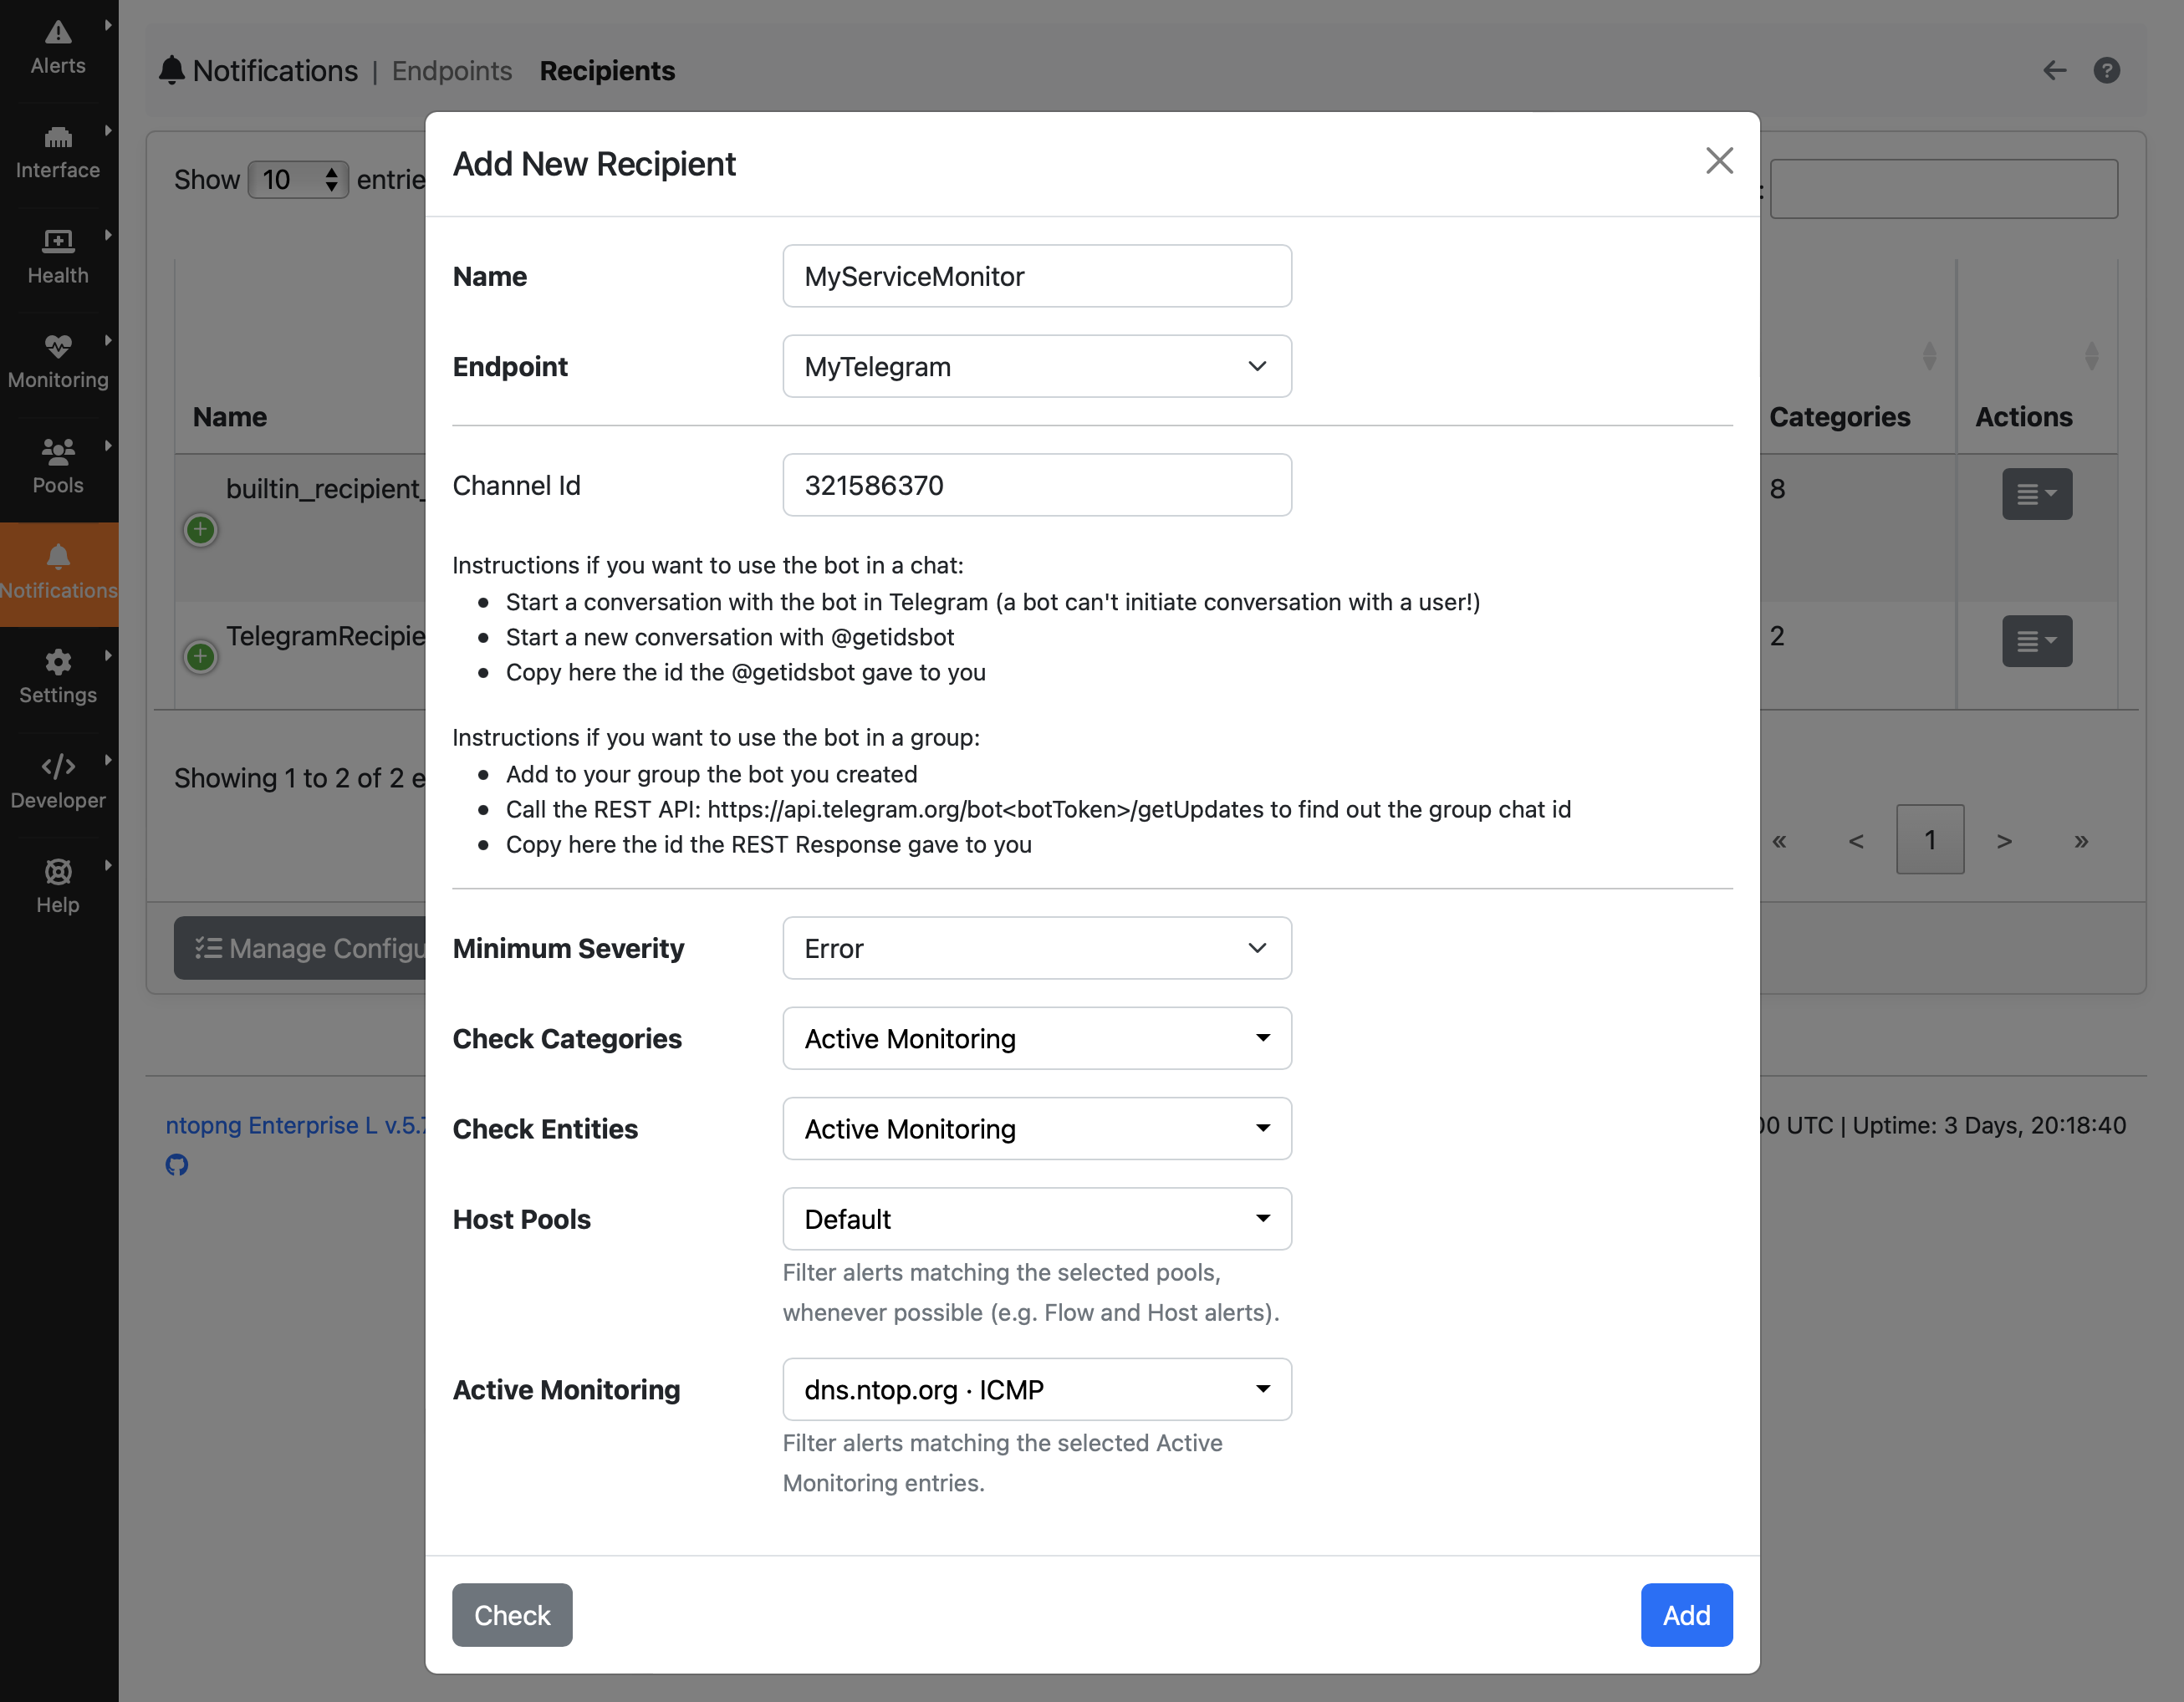
If we want to get notified through some of the endpoints (e.g. messaging systems) supported by ntopng, we can go and configure this from the Notifications page.
For instance, let’s assume that we want to receive a message on Telegram on our mobile phone. First of all we should create a new endpoint from the Notifications -> Endpoint page, where we specify the endpoint type (Telegram) and the required parameters.
Then we need to create a recipient for delivering alerts generated by the Active Monitoring support from the Notifications -> Recipient page, where we specify which alerts we want to receive, filtering them by Severity, Category, Entity, and finally the Active Monitoring entries that we want to monitor.
React (Automatically)
In some case, we can do something better than just getting notified (actionable results), because:
- A manual reaction to the notification may take time
- It may be we are away, busy, or even sleeping and not able to react at all
- It is possible to fix the service with a task which is easy to automate (e.g. a simple service restart)
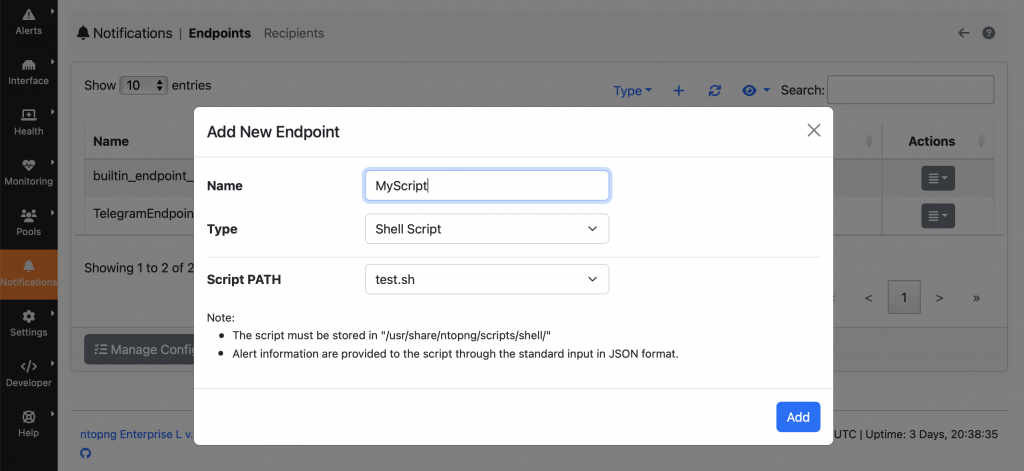
In ntopng it is possible to automatically react to events like alerts generated by the Active Monitoring and run custom action. One way for achieving this is, for instance, running a shell script or calling a web-hook.
In order to run a shell script:
- Create the script (with .sh or .py extension and executable permission) under /usr/share/ntopng/scripts/shell/. In order to get alert information, they are provided to the script as standard input in JSON format.
- Create a new endpoint from the Notifications -> Endpoint page, specifying Shell Script as endpoint type and by selecting the script from the dropdown.
- Create a recipient from the Notifications -> Recipient page, specifying for which service we want to run the script.
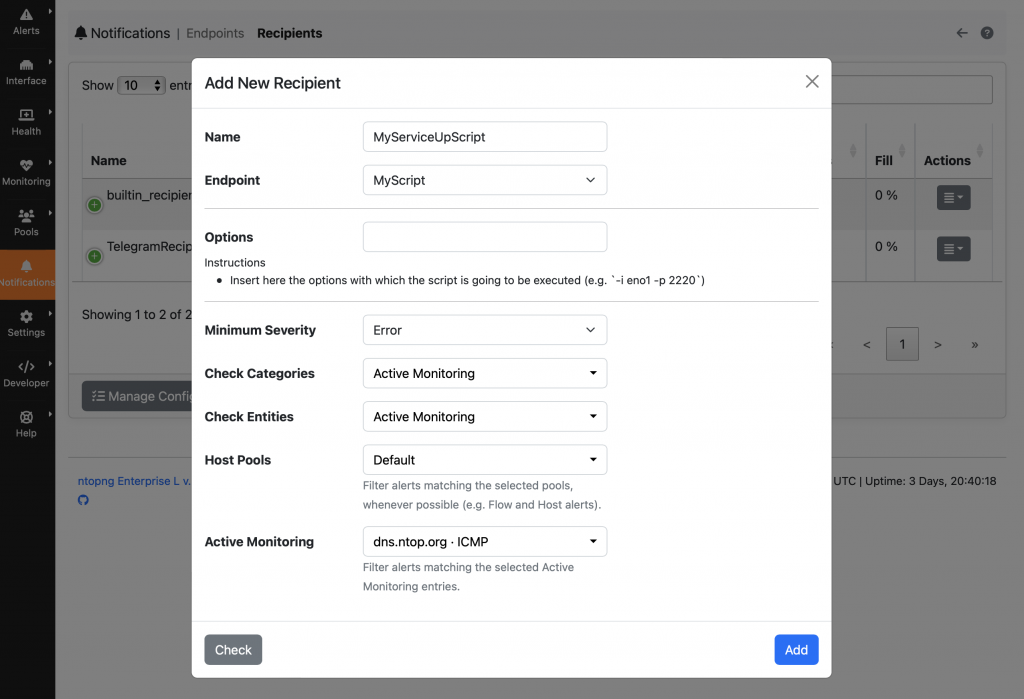

This way you can restore a service with an automatic action, or simply notify a peer: just create a script that can perform the action you need.
Enjoy !