Recently, we added the ability in ntopng to monitor link utilisation using NetFlow/IPFIX. In this post, we want to show you how we further improved those functionalities by leveraging SNMP to monitor the status of many devices (interfaces) simply. SNMP is a well-known protocol used for monitoring network devices, and ntopng uses it to poll and gather information from them. ntopng computes the interface usage by using a simple proportion between the traffic metered via SNMP and the interface speed. The interface speed is read by default from SNMP, but it can be customised by the user as sometimes the physical and actual interface speeds are different.
Let’s see now how it is possible to configure SNMP link speeds and monitor them to detect unexpected behaviours with SNMP polled devices.
Similar to what happens with the Flow Exporters speed, by going to the SNMP page, selecting an interface of a device, and jumping to the configuration page (cog icon) it is possible to configure the link speed (Up and Down independently) of a specific interface.
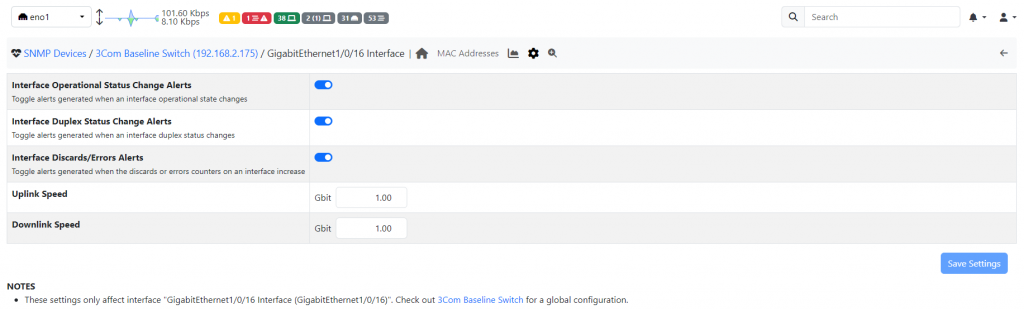
As already mentioned above, this speed is automatically read using SNMP, however not all the times detected speed is correct, consider the example of being connected to the Internet with a 1 Gbit ethernet link but your SLA has a cap of 100 Mbit, in this case the right speed to configure is 100 Mbit.
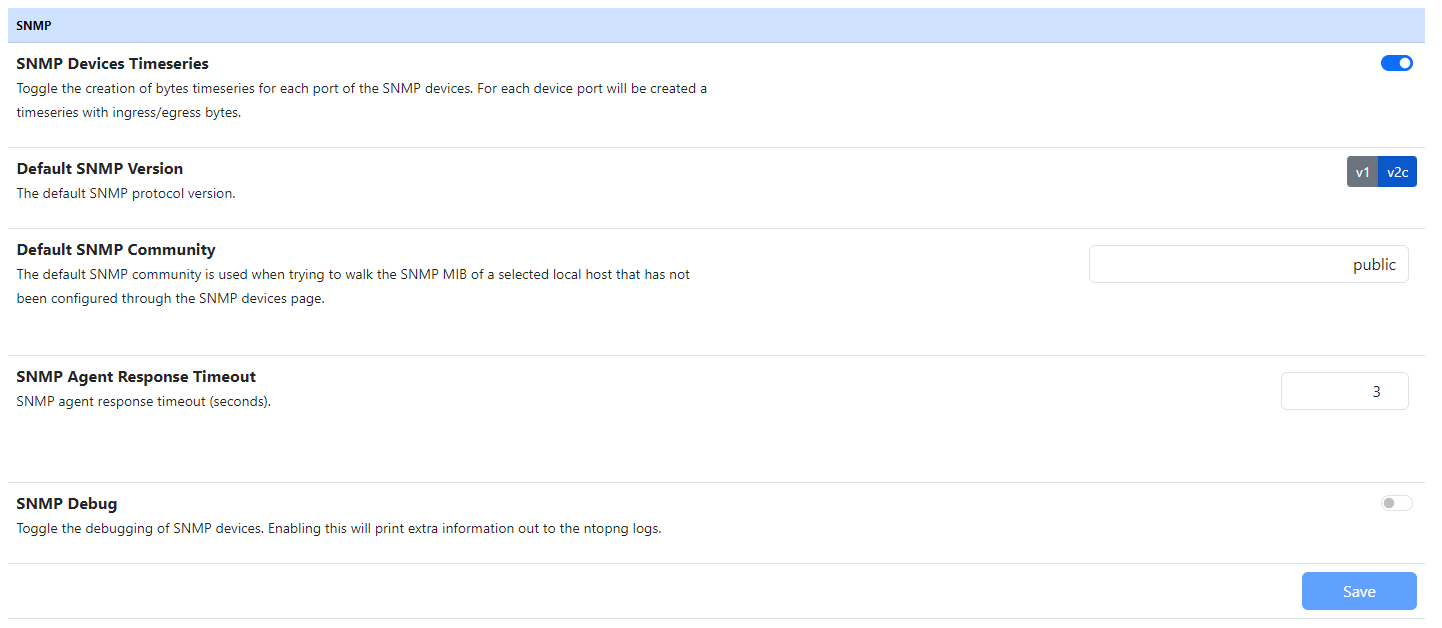
After setting the interface speeds, save the settings, jump to the Preferences (under the Settings menu), in the SNMP section and be sure to have the “SNMP Devices Timeseries” preference enabled.
From now on, a new timeseries is going to be available in the SNMP Interface Timeseries section (accessible from the chart icon, highlighted in green in the above picture) with the interface usage in percentage.
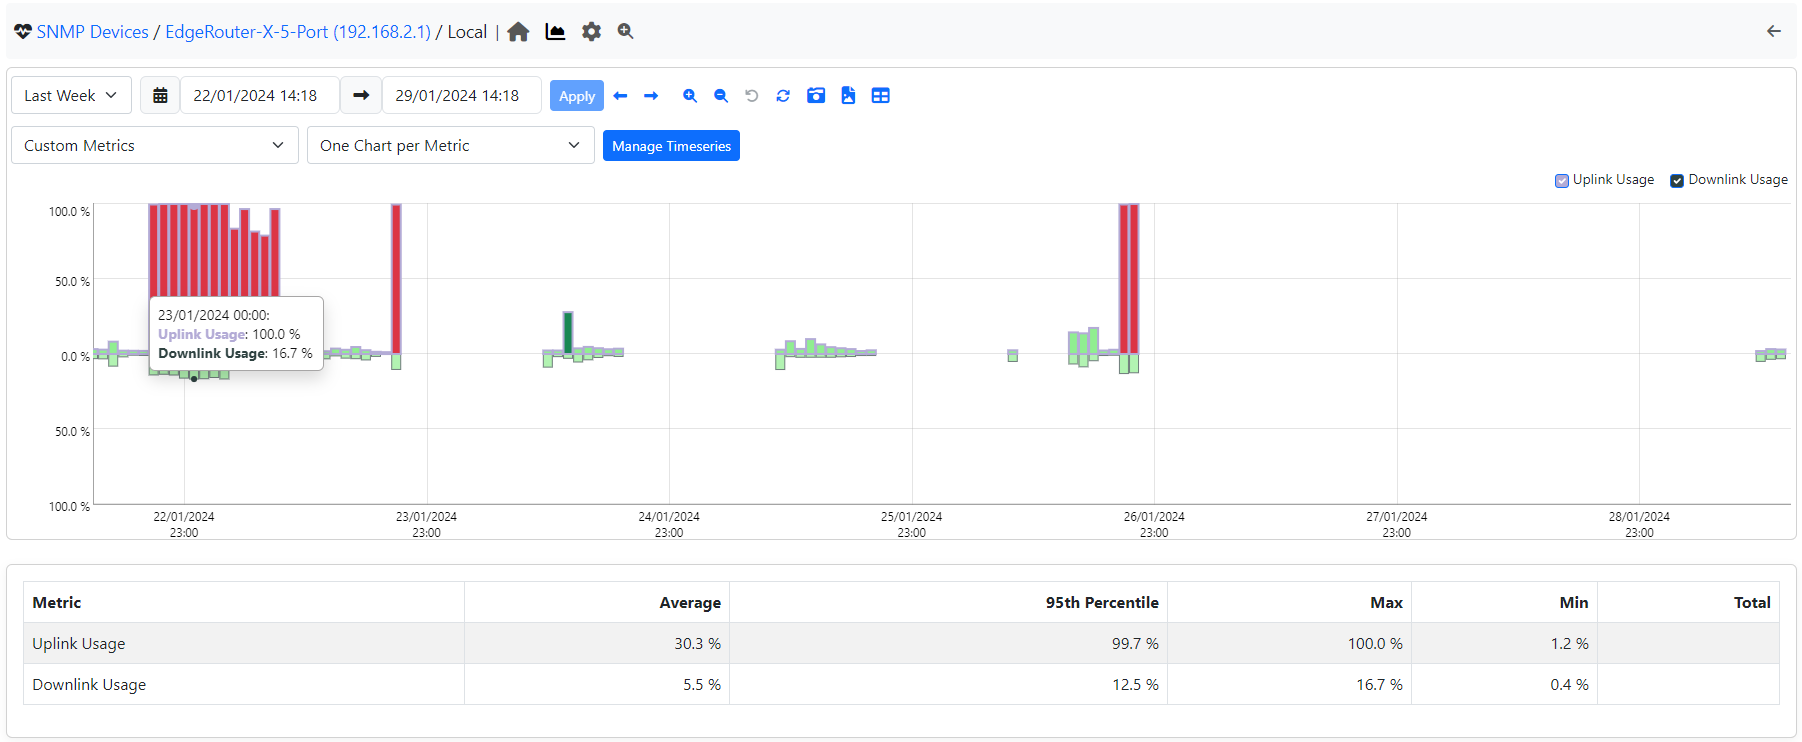
When the usage is <= 25% the bar is light green, from 25 <= 50% is dark green, from 50 <= 75% is yellow, and above is red. However, while developing this feature, we realised that with hundreds, or even thousands, of interfaces, it is impossible to jump to all of them one by one and check whether everything is ok. In addition to that, having an interface “Congested” (i.e. high traffic load) for a short period, may or may not represent a real issue: in most cases, it is not, for example, in the case of a backup we have a couple of hours a week were the bandwidth of the interface is filled.
For this reason, we decided to gather all this information together and put it on a single page.
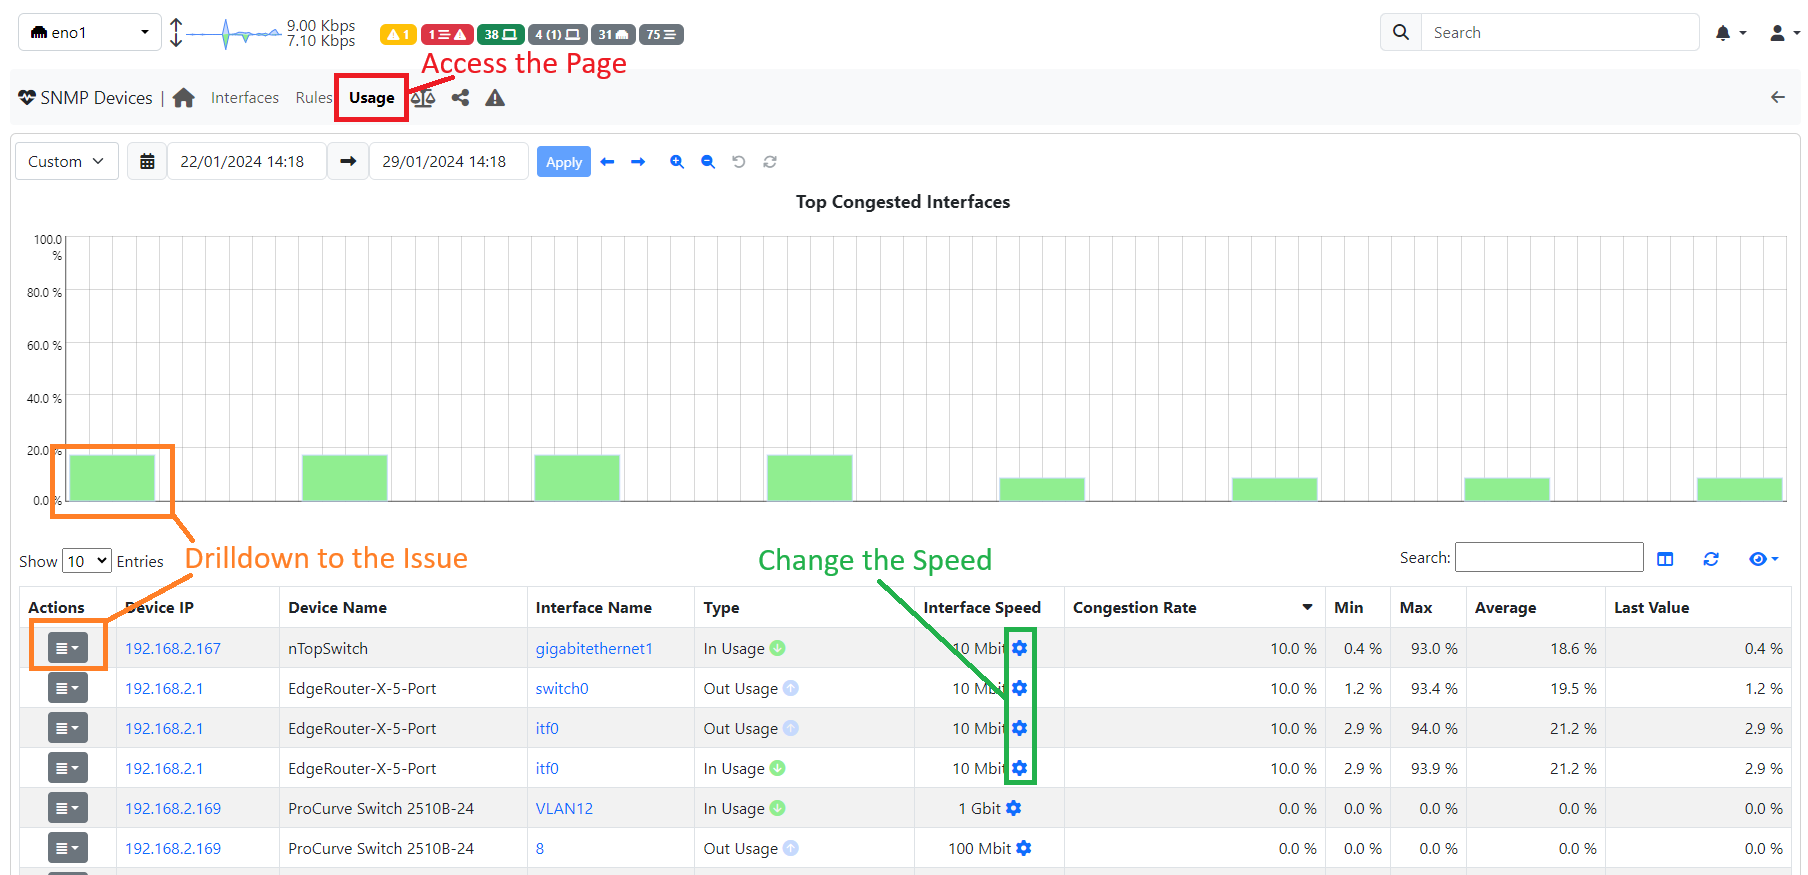
Here it is possible to navigate through time (by using the classic time navbar) and find if any interfaces had problems. In addition to the standard information (SNMP IP, Interface Name, etc.) we introduced a new metric called “Congestion Rate”, representing how much an Interface is filled in the selected timeframe.
For those who like formulas, the Congestion Rate is computed in the following way: sum all the points of the timeseries with usage higher than 75% and divide it by the number of total points in timeseries in the selected timeframe. In practice, this is similar to the average.
After finding some issue with the Congestion Rate of an interface, it is possible to drill down and do follow-up investigations by directly clicking on the bar of the Top Congested Interfaces chart or by clicking on the Actions -> Timeseries button.
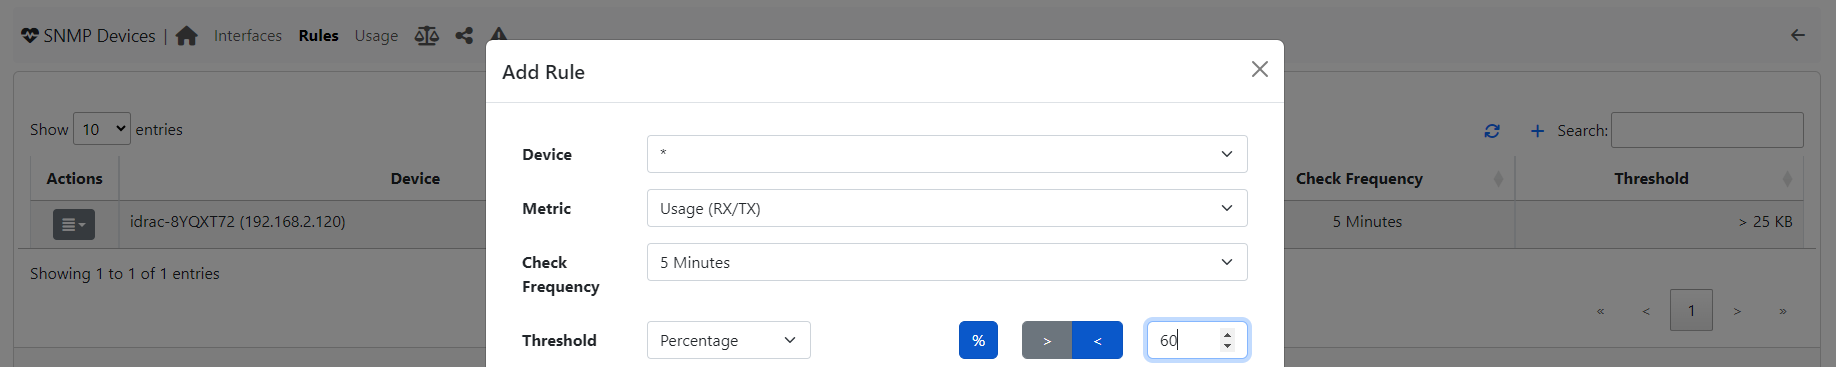
And this is not all. As promised, we also added the ability to trigger conditional alerts based on the interface usage. It is now possible, for both SNMP and Flow Exporters, to trigger alerts when the usage exceeds a specific configurable threshold by using Traffic Rules.
For you reference you can read more about interface utilisation in the ntopng user’s guide.
Enjoy this new feature, and send us your feedback!