
Distributed Denial of Service (DDoS) attacks represent a family cyber-attacks that are more and more common nowadays. They aim to make the service unavailable by overwhelming the victim with high traffic volumes (this is the case of volumetric or amplification attacks based on UDP, ICMP, DNS, …) or an high number of requests (including TCP connection attacks like the SYB flood, or Layer 7 attacks able to exhaust the resources of the service at the application level). This differentiate them from other cyber-attacks like intrusion attacks or malwares aiming to destroying, stealing or compromising data. With the proliferation of IoT devices, the number and entity of these attacks is exploding.
A traditional security device, like a firewall or an IPS, is not able to cope with such attacks, as they have not been designed to process and filter bad traffic at high volume/rate and with an high number of sessions. Those attacks are usually able to exhaust the resources of such security devices, which become the first point of failure.
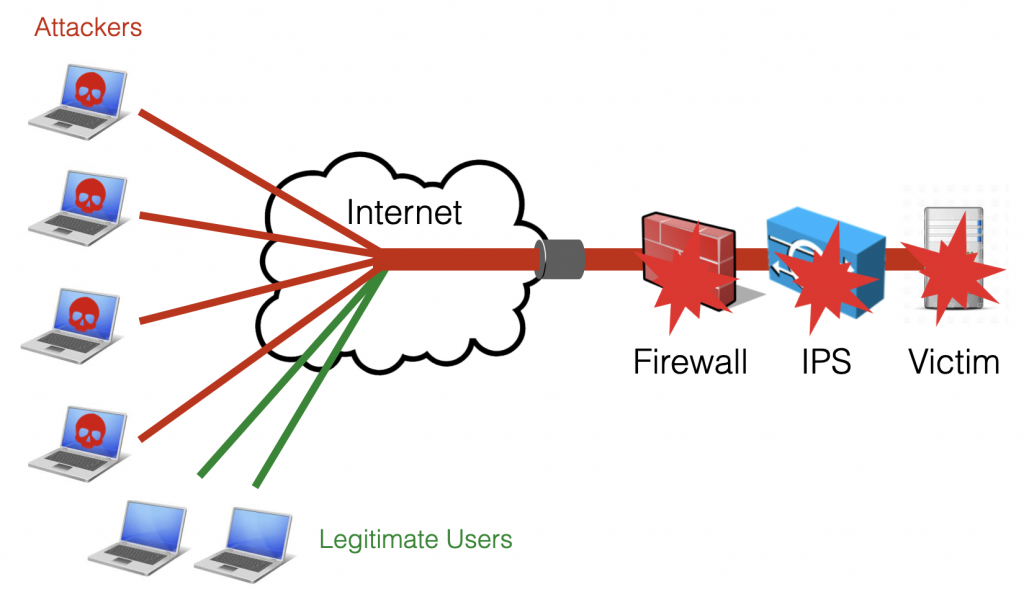
A dedicated device should be used to protect the network (including traditional security devices) from DDoS attacks. Such device is usually known as mitigator or scrubber, and should be able, during an attack, to filter the traffic in order to make sure that 1. legitimate users are able to reach the service and 2. the service stays up and is able to serve the legitimate requests.
nScrub is a software-based protection system able to mitigate DDoS attacks on commodity hardware. nScrub is able to process 10+ Gbit full-rate traffic on a low-end 4-6 core Xeon CPU, and scale to Terabit using multiple blades, load balancing the traffic through multiple links with mechanisms like ECMP. nScrub can be easily deployed as bump-in-the-wire (a transparent bridge, with hardware bypass support to handle system failures or maintenance) or as a router to implement on-demand traffic diversion.
This step-by-step guide aims to get you started with nScrub, guiding you from the software installation to the policy configuration in order to setup a mitigation box protecting your services in minutes.
1. Select the Hardware
nScrub is multithreaded and able to process more than 10 Gbps full-rate on a low-end CPU load-balancing the traffic to 4-6 cores using RSS queues on Intel adapters supported by PF_RING ZC accelerated drivers. Just to mention a couple of sample hardware configurations, a Xeon E3-1230 v5 4-cores 3 Ghz or a Xeon E-2136 6-cores 3 Ghz should be fast enough for processing a 10 Gbit segment. As of the Network adapter, Intel 82599 or X520 are usually recommended, and the same chipsets are also available with the hardware bypass extension from Silicom (this would help a lot reducing down-time during maintenance and setup, or in case of system failures).
2. Install the Software
Instructions for configuring the ntop repository available at packages.ntop.org according to your Linux distribution. In this post we will go through the configuration steps for Ubuntu, similar instructions will also work on other distibutions including Debian and CentOS.
As first step we need to install at least pfring (the packet capture driver) and nscrub (the mitigation tool):
sudo apt-get install pfring nscrub
3. Configure the Driver
The pfring package includes a basic packet capture module that can be used with any adapter. In order to take advantage of the full PF_RING ZC acceleration on Intel adapters, a ZC driver needs to be installed, configured and loaded based on the adapter model. The pf_ringcfg tool installed with pfring takes care of this.
Check the adapter and driver model.
sudo pf_ringcfg --list-interfaces
Name: enp2s0f0             Driver: ixgbe      [Supported by ZC]
Name: enp2s0f1             Driver: ixgbe      [Supported by ZC]
Install and configure the driver. The number of RSS queues (as many as the physical CPU cores available at most) should be configured to load-balance the traffic to multiple CPU cores and get optimal performance.
sudo pf_ringcfg --configure-driver ixgbe --rss-queues 4
Make sure that the driver has been loaded.
sudo pf_ringcfg --list-interfaces
Name: enp2s0f0             Driver: ixgbe      [Running ZC]
Name: enp2s0f1             Driver: ixgbe      [Running ZC]
4. Configure the nScrub Service
The nScrub service configuration may differ a bit depending on the deployment mode (transparent bridge, routing mode with a single or two interfaces, etc.). In this guide we assume the most common configuration is used, which is the transparent bridge (bump in the wire).
The /etc/nscrub/nscrub.conf configuration file should be created as below.
# WAN interface name
--wan-interface=zc:enp2s0f0

# Internal interface name (optional when using routing mode)
--lan-interface=zc:enp2s0f1

# Unique ZC cluster ID
--cluster-id=99

# Processing thread(s) CPU core(s) affinity
--thread-affinity=2:3:4:5

# Time thread CPU core affinity
--time-source-affinity=1

# Other threads affinity
--other-affinity=0

# CLI/REST listening address
#--http-address=127.0.0.1

# Monitor queues
--aux-queues=2
# System log file path
--log-path=/var/log/nscrub/nscrub.log
Where:
- –wan-interface is the interface towards Internet, from which attacks are received
- –lan-interface is the interface towards the local network, where the victim services are located
- –thread-affinity is a list of cores that should be used for traffic processing, one for each RSS queue (in this configuration we are assuming a CPU with 6 cores, 4 of which will be used for traffic processing, 2 for auxiliary threads and applications)
- –http-address specifies the IP address where the service will be listening for controlling the engine and configuring the policies using the CLI tool (nscrub-cli) or the RESTful API. This is set to localhost only by default for security reasons, preventing the connection from remote boxes.
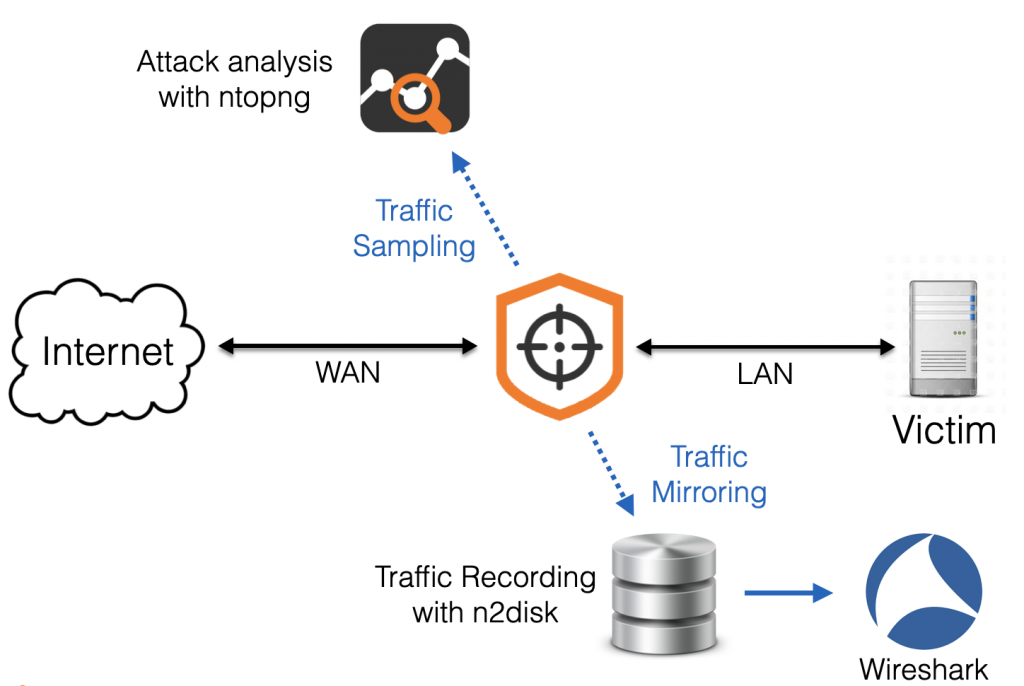
- –aux-queues=2 specifies the number of traffic mirrors where nScrub will send a (sampled) copy of the traffic for providing more visibility or traffic recording, by analysing the traffic with external tools (e.g. ntopng and n2disk)
A REST API over HTTPs is provided by nScrub in order to control the engine, which is also used by the nscrub-cli tool. This requires the installation of a SSL certificate, that can be created by running the below commands.
openssl req -new -x509 -sha1 -extensions v3_ca -nodes -days 365 -out cert.pem
cat privkey.pem cert.pem > /usr/share/nscrub/ssl/ssl-cert.pem
Note: the license for both nScrub and PF_RING ZC for Intel (one for each interface), should be installed before running the service.
Enable and run the service.
systemctl enable nscrub
systemctl start nscrub
After running the nScrub service in transparent bridge mode, all the traffic is just forwarded between the two interfaces as in a standard bridge. In order to enable traffic inspection and mitigation, we need to configure the hosts or networks to be protected, by specifying the desired protection policies.
5. Configure the Mitigation Policies
Configuring the protection policies requires the creation of one (or more) target, which is logically a set of IPs or subnets running homogeneous services. In fact nScrub supports multiple sets of protection policies, which are tied to different targets, implementing multi-tenancy and providing the flexibility of applying different policies based on the target type.
Targets and protection policies can be created and configured at runtime using the nscrub-cli tool or the REST API. An additional tool, nscrub-add, is also available for the impatient to create a basic configuration, simply specifying the service type and IP/subnet (example: nscrub-add WEBSERVER 192.168.1.1/32 web). In this guide we will use the nscrub-cli tool to create a custom configuration, to be able to fine-tune the target configuration. However the same tool can be used to modify a target configuration previously created with nscrub-add.
It is possible to run nscrub-cli on the same machine or on a different machine (please make sure you are configuring –http-address in nscrub.conf with the right listening address), in the latter case please specify the address of nScrub with -c HOST:PORT.
Running the nscrub-cli command, an interactive prompt with auto-completion is presented where you can issue commands (type h for the help), or alternatively batch mode is also available (create a configuration file and load it with cat policy.conf | nscrub-cli).
add target mynet 10.10.10.0/24
add target mynet 192.168.1.0/24

target mynet type hsp

target mynet profile DEFAULT default drop
target mynet profile WHITE all accept enable
target mynet profile BLACK all drop enable
target mynet profile GRAY default drop

target mynet profile DEFAULT tcp syn check auto
target mynet profile DEFAULT tcp syn check_method rfc

target mynet profile DEFAULT udp checksum0 drop enable
target mynet profile DEFAULT udp fragment drop enable

target mynet profile DEFAULT udp dst 123 accept enable

target mynet profile DEFAULT dns request check_method forcetcp
target mynet profile DEFAULT dns request threshold 1000

target mynet profile DEFAULT icmp type 0 accept enable
target mynet profile DEFAULT icmp type 8 accept enable
In the above example a target mynet is created (an arbitrary name can be used) configuring a couple of subnets. The service type has been set to hsp (Hosting Service Provider), which is just a hint for the mitigation engine, but you should not worry much about the effect of this as we are going to manually configure the protection policies. After that, the default protection policies are configured for the four profiles which are default (unknown traffic), black (bad traffic), white (good traffic) and gray (an extra profile the can be used for special policies). Each profile is tied to a list: IPs can be manually added to those lists (we can blacklist an IP by adding it to the black list). At this point the protection policies for each protocol can be configured (the protection algorithm for TCP, the allowed UDP ports and ICMP types, etc), please check the help or the documentation for a full list of settings.
At this point the system is up and running, mitigating attacks towards the configured target.
6. Monitor the System
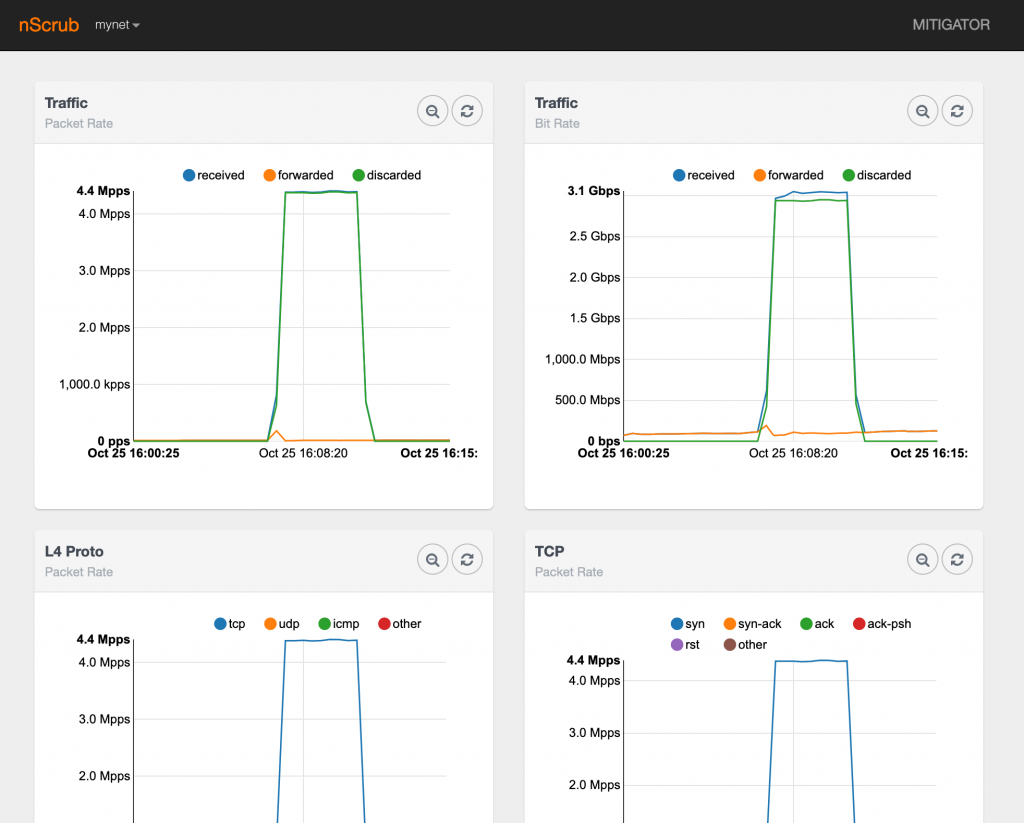
The easiest way to read statistics and make sure nScrub is actually processing traffic is to run the stats command in nscrub-cli. Statistics about a specific target can also be read by running target mynet stats in nscrub-cli. However this provides the actual statistics only.
Historical statistics are available from the web GUI which is available using a browser connecting to http://NSCRUB-IP:8880/monitor.html (please make sure you are configuring –http-address in nscrub.conf to allow connections from remote machines).
In addition to basic traffic statistics, nScrub is able to export a copy of the raw traffic to third-party applications via software queues, for providing enhanced visibility. In the nscrub.conf configuration above we already enabled a couple of traffic mirrors with –aux-queues=2, thus we are able to use up to two applications to concurrently analyse the traffic.
It is possible to configure what traffic should be forwarded to both mirrors (respectively with IDs 0 and 1), and the sampling rate to avoid overwhelming the third-party applications with traffic in the worst case.
mirror 0 type all
mirror 0 sampling 1000
mirror 1 type discarded
mirror 1 sampling 1000
Please note that nScrub creates one software queue for each RSS queue/thread, thus in this case we will have 4 queues for each mirror. Please find below a sample configuration file for ntopng that you can use for analysing the traffic that is provided by nScrub. In this case we are configuring ntopng to capture from all queues in the mirror, and setting up a view interface in ntopng to provide aggregated data.
-i=zc:99@0
-i=zc:99@2
-i=zc:99@4
-i=zc:99@6
-i=view:all
-g=0
-y=1
At this point you can start ntopng and connect to the web GUI for analysing the traffic.
In a similar way it is possible to dump the traffic to a PCAP file using n2disk or tcpdump, capturing from zc:99@1, zc:99@3, zc:99@5, zc:99@7.
tcpdump -Q in -ni zc:99@1 -c 1000 -w attack.pcap
And you can analyse the PCAP in Wireshark or any traffic analysis tool.
Enjoy!