
For this reason, some time ago we introduced the Infrastructure Monitoring in ntopng, as described in a previous blog post, which is the ability to use ntopng to monitor other ntopng instances, by means of its Active Monitoring capabilities. This infrastructure monitoring feature allows users to gain real-time insights into the status of their ntopng instances, as well as monitor the network interconnecting them.
Now, we are excited to introduce a further extension to the Infrastructure Monitoring in ntopng, the new Infrastructure Dashboard. This enhancement enables users to efficiently oversee multiple regions in a unified interface while allowing granular drill-down into specific regions when needed.
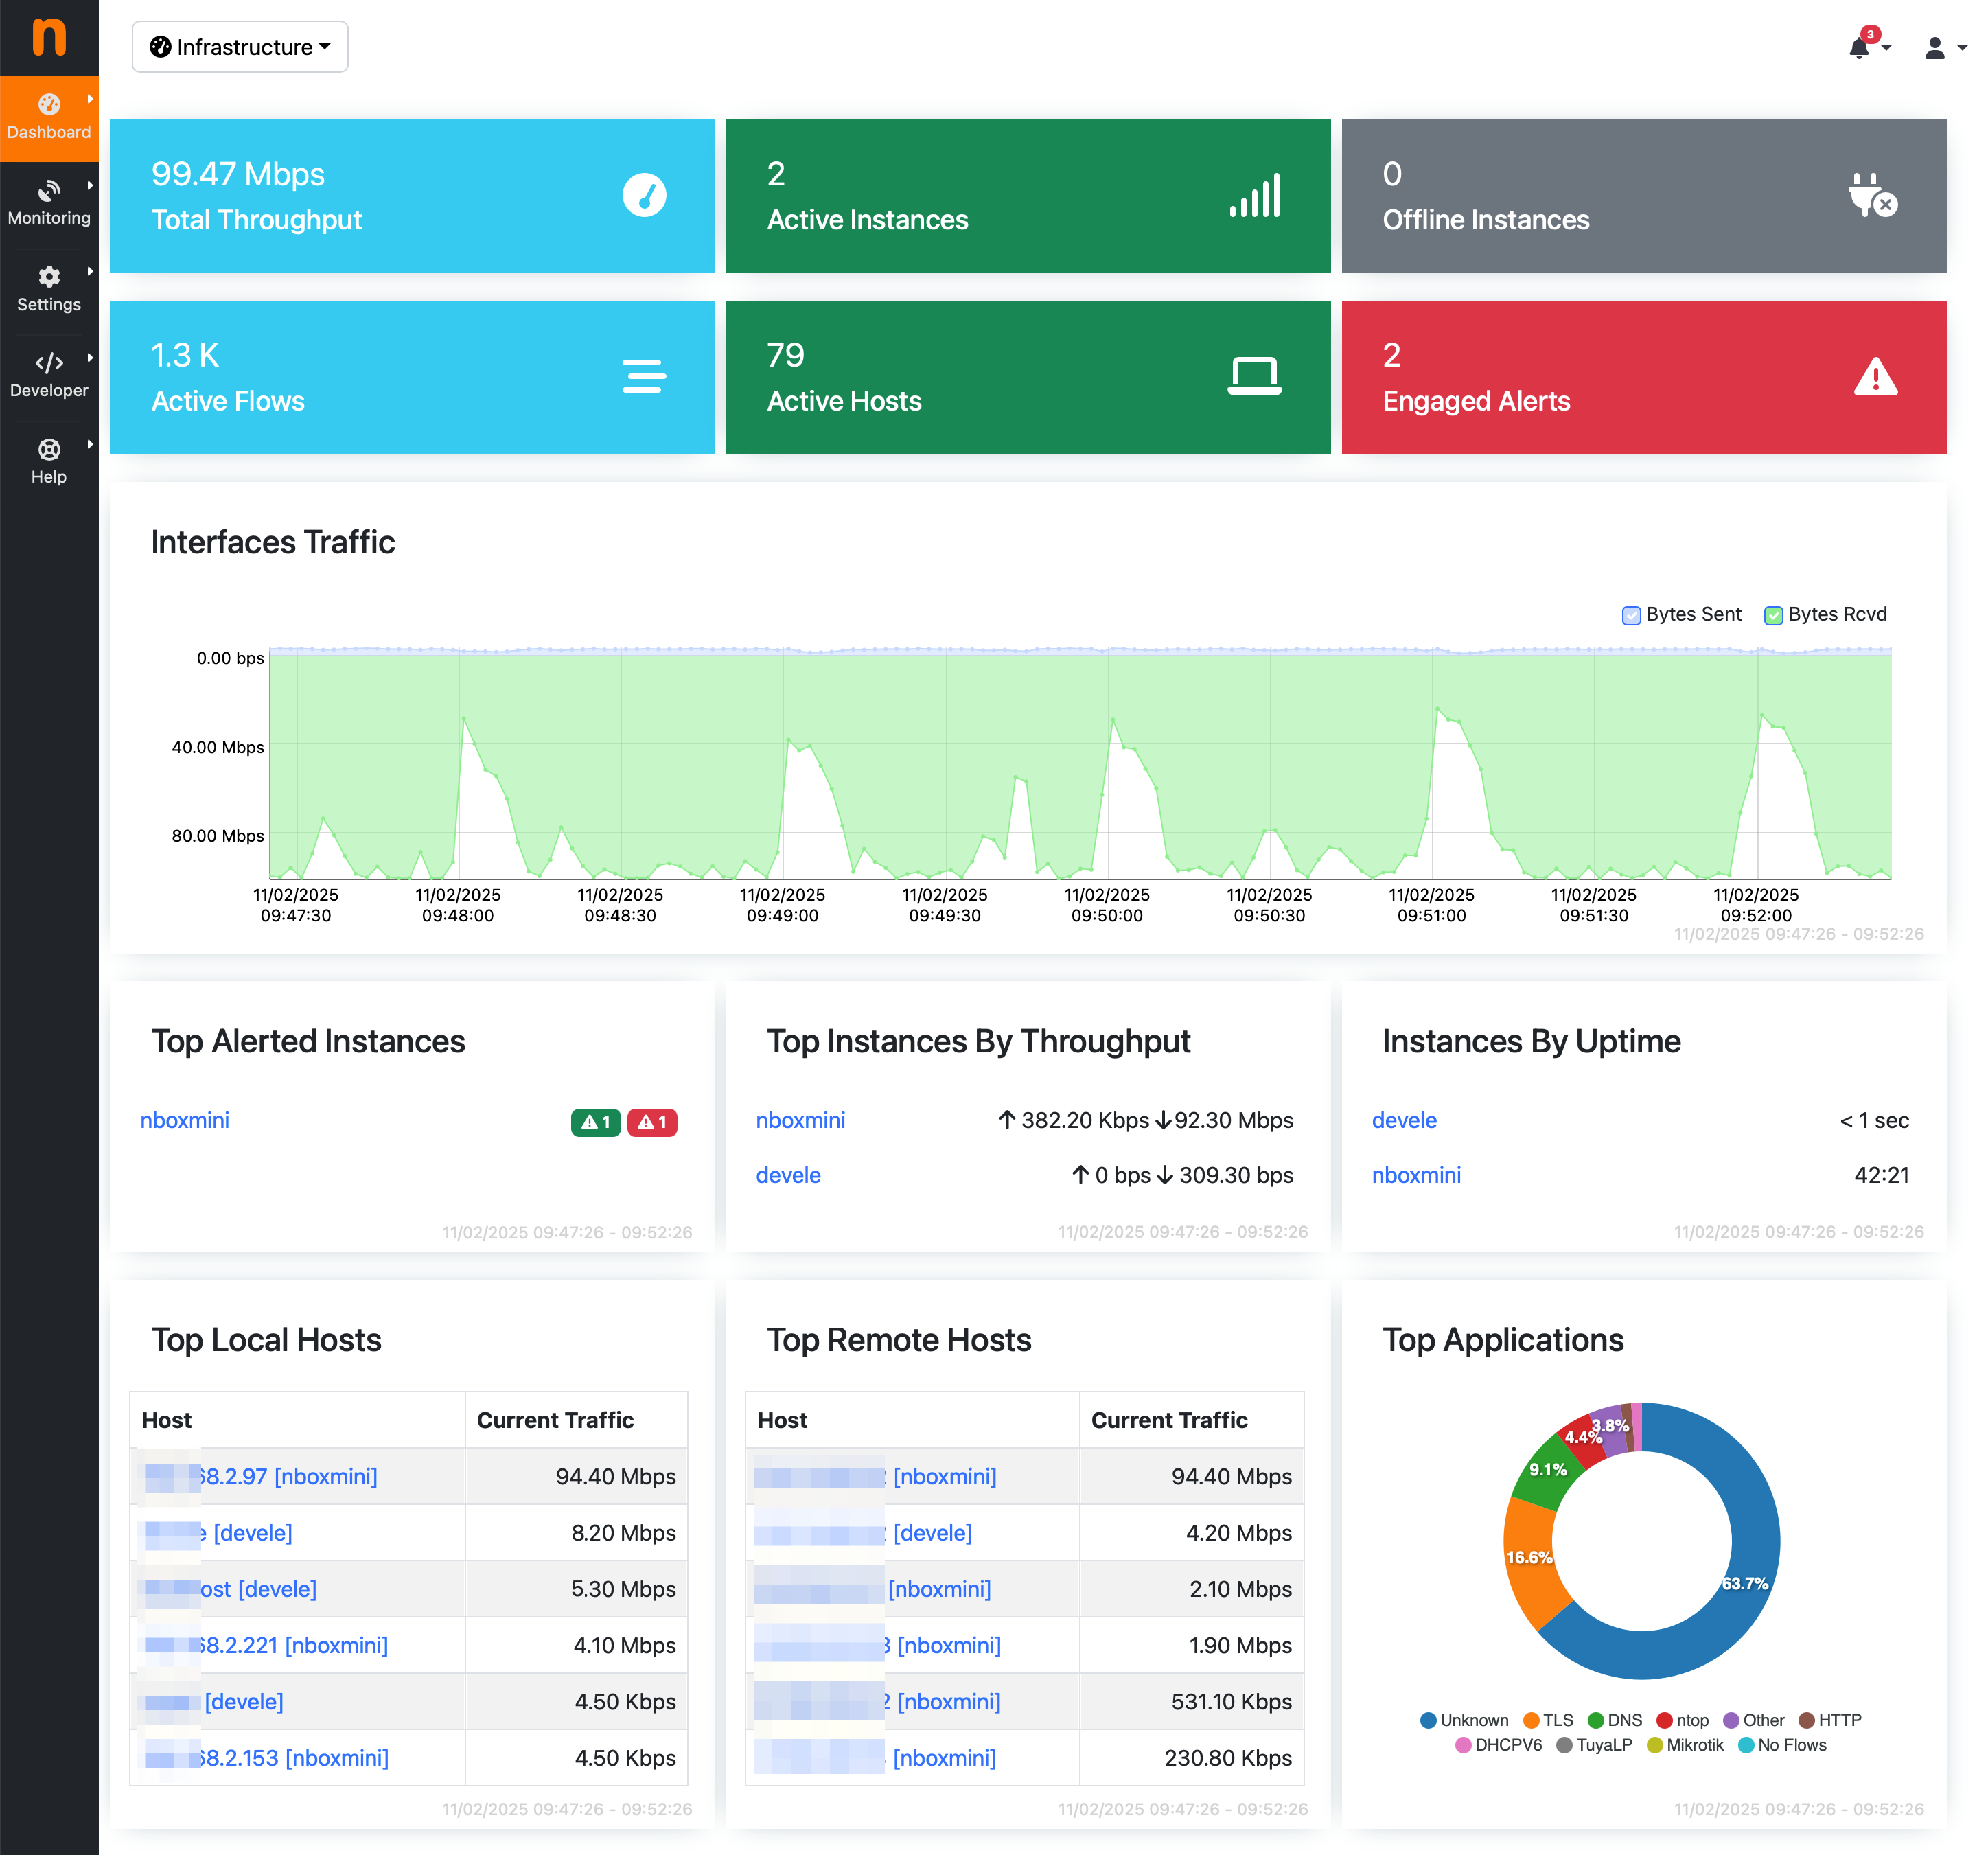
With the Infrastructure Dashboard, users can:
- Monitor multiple ntopng instances across regions, gaining a real-time view of all monitored ntopng instances across different geographical locations, ensuring full infrastructure awareness.
- Track total monitored bandwidth across regions, understanding the overall bandwidth consumption of the entire distributed network, including traffic per application protocol.
- View active alerts per region, to stay informed about issues triggered by any ntopng instance and quickly identify affected regions.
- Identify top hosts across the entire network, to pinpoint the most active hosts across all monitored locations and speedup traffic analysis.
- Analyze aggregated and regional metrics with access to a range of performance indicators at both global and regional levels, making it easy to detect anomalies and performance bottlenecks.
All this is available in a centralized interface, while also allowing users to drill down into specific regions when deeper analysis is required.
How to Get Started
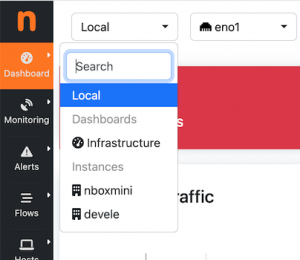
The Infrastructure Dashboard is available in the latest (dev) version of ntopng (the next stable version will include it too). If you are already using ntopng for monitoring a distributed network with the Infrastructure Monitoring, simply update to the latest release to take advantage of this powerful new feature: a new dropdown at the top of the UI will appear, with a Infrastructure Dashboard entry.
For those new to ntopng, setting up infrastructure monitoring across multiple regions is straightforward, and the dashboard will instantly provide a clear, high-level overview of your monitored instances while supporting in-depth regional analysis.
Enjoy!