ntopng was initially designed as a tool for realtime network traffic monitoring. The idea was to create a DPI-based tool able to report traffic statistics. Overtime we have added the ability to implement active monitoring checks, SNMP, and various other features. However there was a fundamental point that was missing: go beyond traffic reporting, moving towards traffic analysis. The current Grafana-like trend of having several large screens full of dashboards is the opposite of what we believe we should do. This approach requires network and security administrators to be trained so well to understand whether the network is behaving well or not.
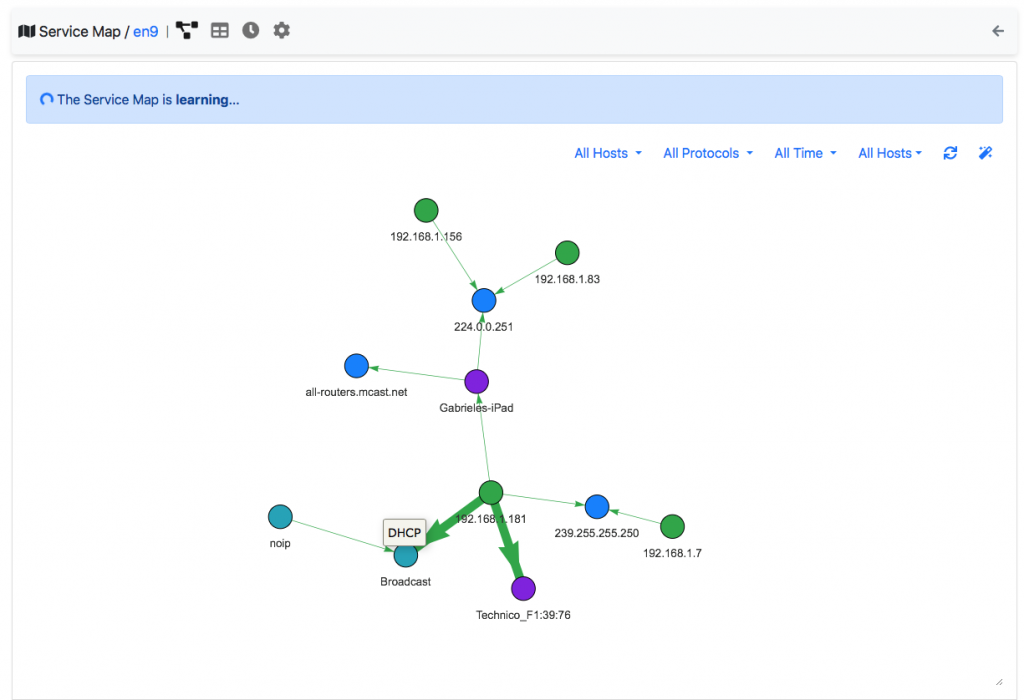
ntopng instead reverts this perspective by implementing an AIOps platform, able to analyse network metrics in realtime while being able to collapse thousand signals into a single comprehensive view of your network status, without human intervention or training typical of machine learning tools. For instance below you can see the service map, that is a representation of interactions of local hosts. ntopng learns this map automatically and enforces changes and violations to the policy. Humans can tune the system by selecting what services are not supposed to flow on the network, but the system has already built the knowledge base automatically, also identifying device types (is this a tablet or a router?) and the type of traffic such devices are expected to do.
In the past months we have introduced the concept of score (you can read this paper for more information on the topic), that is a way to identify with a numerical value how bad is a host currently behaving. When we account the score, we take into account not only the alerts a host generates but also its behaviour: this way we can both detect changes in behaviour that a human operator would be unable to report, in particular in modern networks where there are several thousand signals to watch.
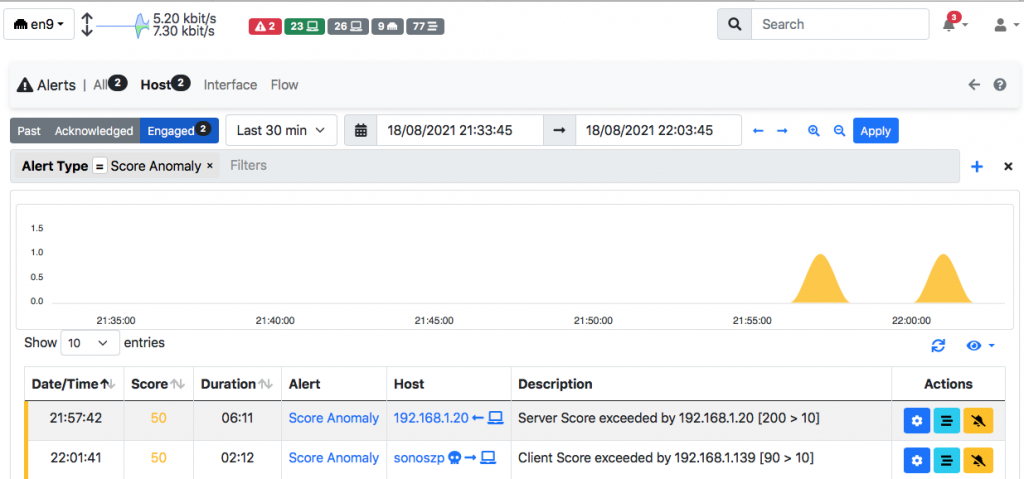
Anomalies as well all other alerts, are reported in ntopng on a new alert dashboard that allows you to correlate the event with traffic and drill-down to the flows that created such alerts.
In essence ntopng is not just reporting what happens, but it also tells you what is wrong or not, and it can notify you on your preferred messaging application. This is a major milestone for ntopng and also for open source software.
Below you can find all details and changes of the 5.0 release.
Enjoy !
Main New Changes and Breakthroughs
During these 9 months we have invested a lot of time and energies to rework the way alerts are handled in ntopng. Initially, host and flow alerts were completely processed in Lua at fixed intervals of time. This architecture, although very flexible and extensible, had several drawbacks:
- Lua is an interpreted language so it is intrinsically more expensive, in terms of CPU clocks, if compared to a compiled language
- Processing at fixed intervals of time poorly utilizes the CPUs, with periods of high load and periods where the system is almost idle
To mitigate these drawbacks, we decided to move host and flow alerts from Lua to C++ and to process them continuously, rather than at fixed intervals of time, to better utilize the CPUs. It was a huge architectural change, but it eventually reduced the average load by 50% and mitigated significantly the load spikes originally caused by fixed-time processing. Here we describe how the new host and flow alerts work, and provide a guide that an interested developer can used as reference to code new alerts.
Among the benefits of having less CPU-intensive alerts is the ability to integrate more tightly with nDPI and its security risks, with ntopng 5.0 now triggering many novel security-related alerts. Alerts are also augmented with intelligence to detect attackers and victims and abrupt changes in host behaviors, e.g., when the score indicator of compromise increase significantly.
The benefits of having a reduced load, along with a less spiky behavior with reference to the CPU activity, also proved to be fundamental to break the barrier of 100Kfps NetFlow Collection. Indeed, ntopng and nProbe can collect, analyze, and dump NetFlow data at a rate that exceeds 100K flows per second. Detailed performance figures can be found here.
However, being able to work at 100Kfps is not that useful, unless there are easy and intuitive ways to drill down into the data that quickly becomes humongous. For the sake of example, consider that a system fills by 36M new flows every hours when it operates at 100Kfps. Therefore, to ease the way data can be drilled down, we added support for observation points in ntopng 5.0. This makes it possible to fluidly drill down data originating at hundredths of routers. The rationale is that, although nowadays 100Kfps is becoming a requirement when it comes to NetFlow collection, it is unlikely to have all those flows generated at a single router. In general, flows come from multiple independent routers that together can sum up to 100Kfps.
Supported Distributions
ntopng 5.0 adds to its supported distributions also FreeBSD 11 and 12, including the popular firewalls OPNsense and pfSense.
Breaking Changes
- To ensure optimal performance and scalability and to prevent uneven resource utilization, the maximum number of interfaces handled by a single ntopng instance has been reduced to
- 16 (Enterprise M)
- 32 (Enterprise L)
- 8 (all other versions)
- REST API v1/ is deprecated and will be dropped in the next stable release in favor of REST API v2/
- The old alerts dashboard has been removed and replaced by an advanced alerts drilldown page with integrated charts
Changelog
The complete list of changes introduced with ntopng 5.0 are:
Breakthroughs
- Advanced alerts engine with security features, including the detection of attackers and victims
- Integration of 30+ nDPI security risks
- Generation of the score indicator of compromise for hosts, interfaces and other network elements
- Ability to collect flows from hundredths of routers by means of observation points
- Anomaly detection based on Double Exponential Smoothing (DES) to uncover possibly suspicious behaviors in the traffic and in the score
- Encrypted Traffic Analysis (ETA) with special emphasis on the TLS to uncover self-signed, expired, invalid certificates and other issues
New features
- Ability to configure alert exclusions for individual hosts to mitigate false positives
- FreeBSD / OPNsense / pfSense packages
- Ability to see the TX/RX traffic breakdown both for physical interfaces and when receiving traffic from nProbe
- Add support for ECS when exporting to Syslog
- Improved TCP analysis, including analysis of TCP flows with zero window and low goodput
- Ability to send alerts to Slack
- Implementation of a token-based REST API access
Improvements
- Reworked the execution of hosts and flows checks (formerly user scripts), yielding a reduced CPU load of about 50%
- Improved 100Kfps+ NetFlow/sFlow collection performance
- Drilldown of nIndex historical flows much more flexible
- Migration to Bootstrap 5
- Check malicious JA3 signatures against all TLS-based protocols
- Reworked Doh/DoT handling
Fixes
- Fixes SSRF and stored-XSS injected with malicious SSDP responses
- Fixes several leaks in NetworkInterface